Fletr User Guide
Overview
Fletr monitors VDA5050 MQTT messages from AGVs connected to an MQTT broker.
Main Features
- Manage broker servers in the left sidebar and keep them across restarts.
- Connect to MQTT (
mqtt://) or MQTTS (mqtts://) brokers. - Subscribe to both
uagv/#(VDA 5050 v1.x / v2.x) andvda5050/#(VDA 5050 v3.0+) messages by default — mixed-fleet brokers work without any configuration. The auto-discovery topic template is still configurable for non-standard prefixes. - See connection status and message count in the dashboard.
- Use a modern full-space layout with a dedicated status bar and scrollable message panel.
- Capture VDA 5050 message history so you can browse what each AGV did, when, and why.
Theme
- The app defaults to the user's OS color scheme preference for first-time users (detected via
prefers-color-scheme). The detected theme is saved to localStorage immediately. - If a theme preference is saved in local storage, that saved mode is applied.
- Use the left utility sidebar to switch between Dark mode and Light mode.
- The utility sidebar is expanded by default and can be collapsed when needed.
- The theme switch button is positioned at the bottom of the utility sidebar.
Desktop App
- The desktop app runs without the native top menu/toolbar for a cleaner dashboard view.
- The title bar includes an info button () to the left of the window controls. Clicking it opens this user guide directly inside the app, including all screenshots.
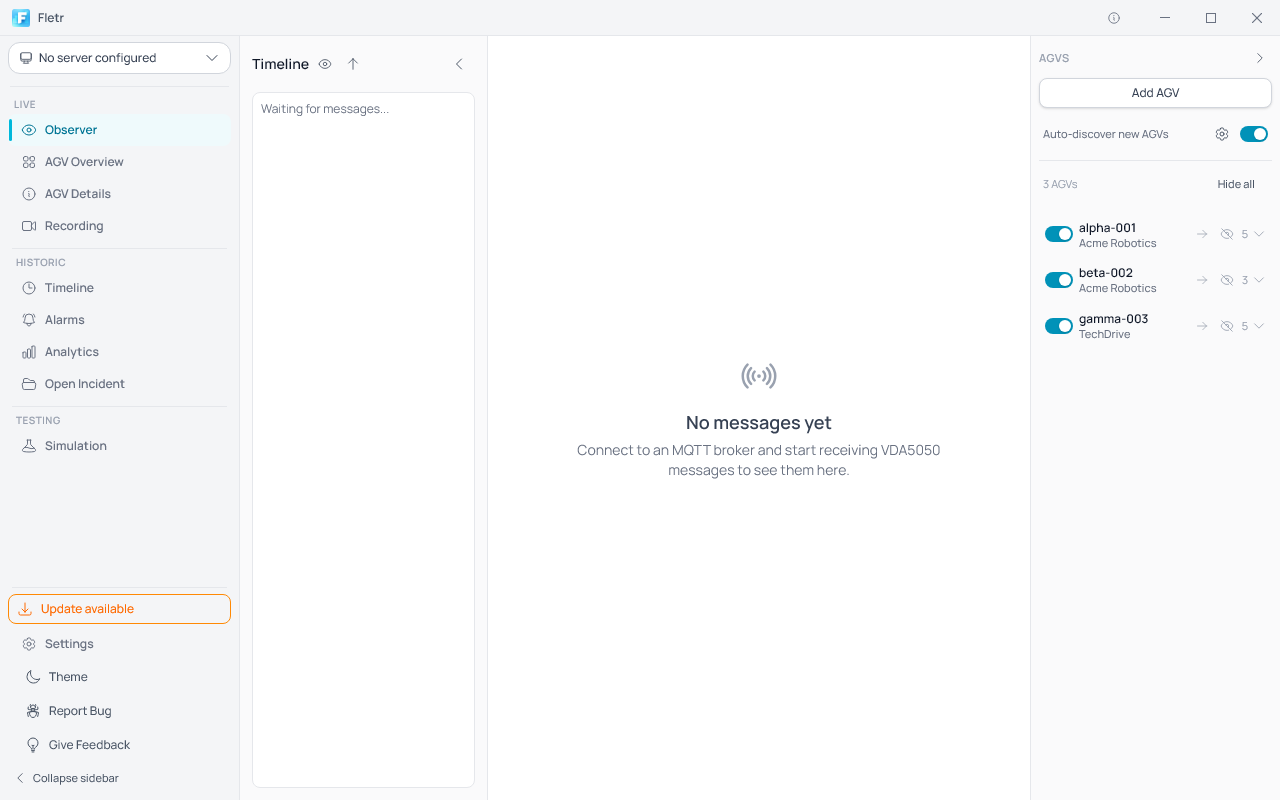
In-App Update Notifications
When a new version of Fletr is available, the app notifies you without interrupting your work:
- An Update available button with an orange outline appears above the Settings entry in the left sidebar.
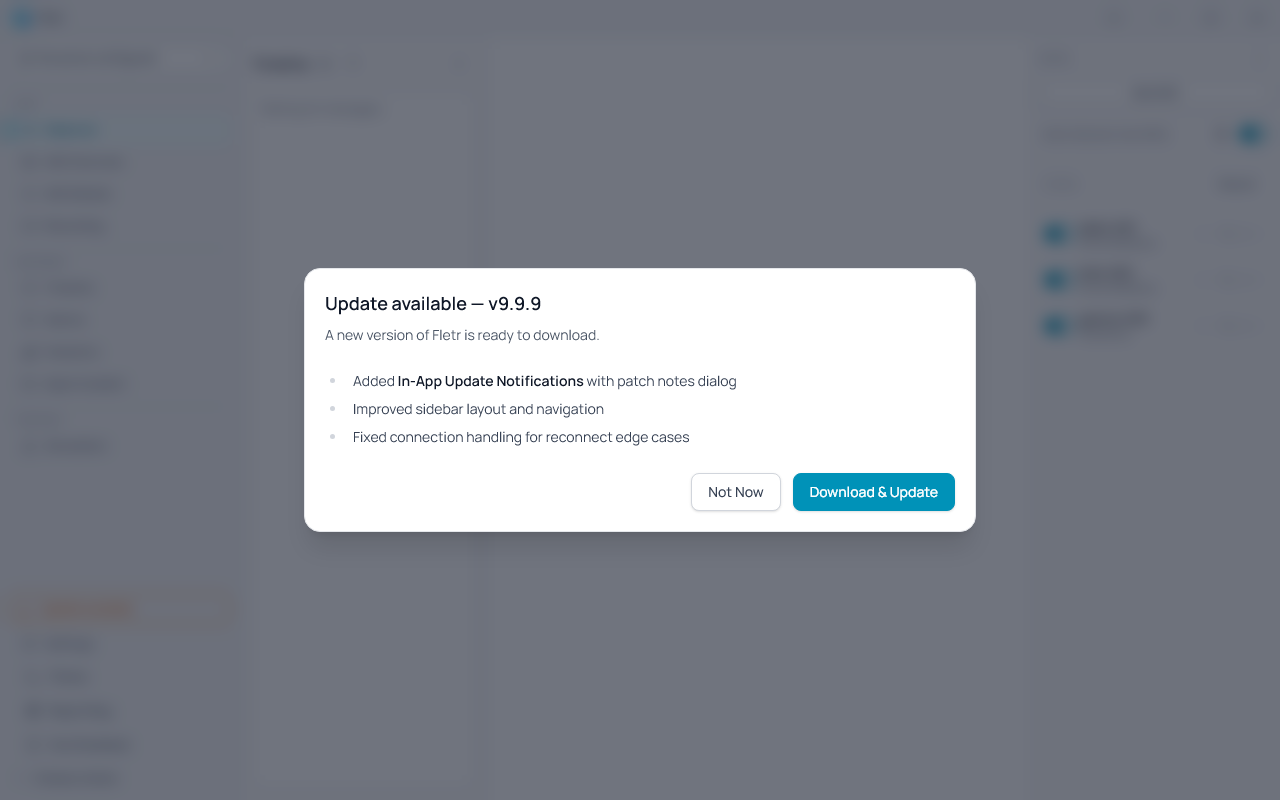
- Click the button to open the Update dialog, which shows the version number and the patch notes for the new release.
- Click Download & Update to start downloading the update in the background. A progress indicator is shown while the download runs.
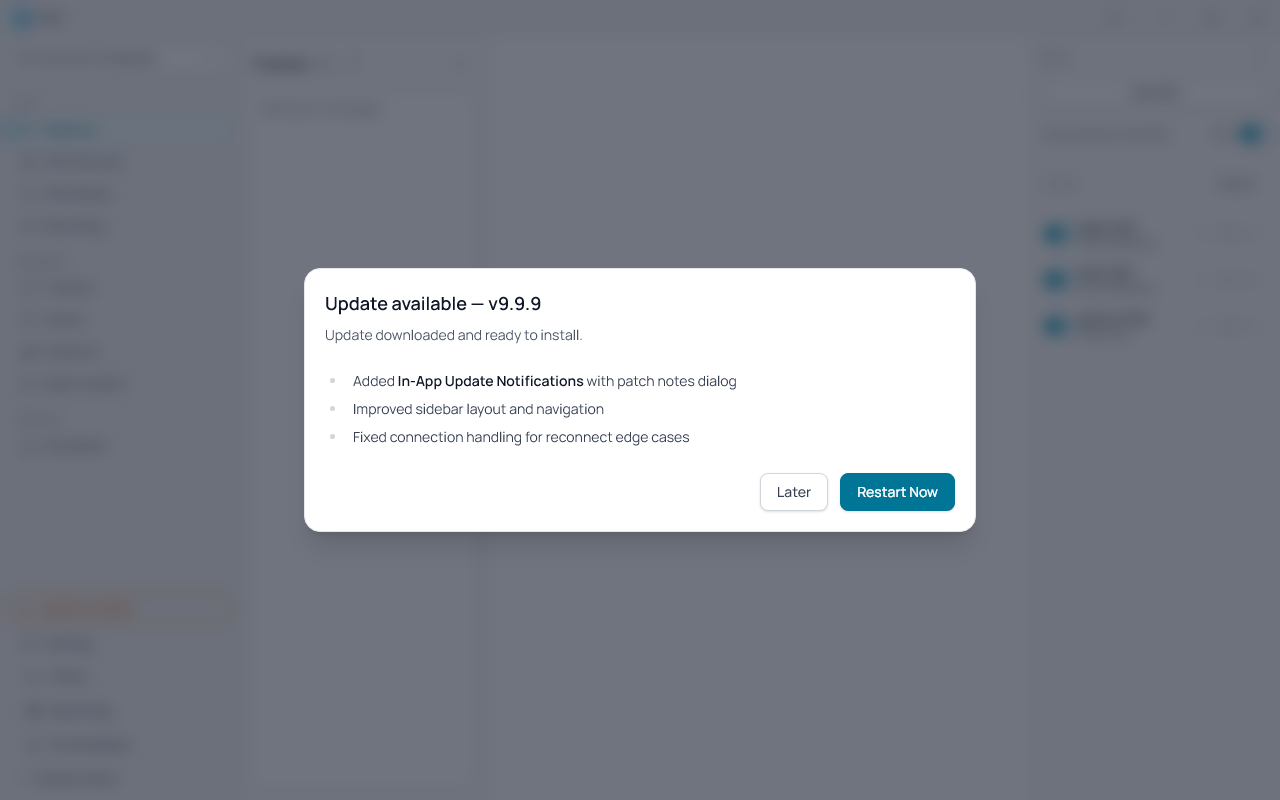
- Once the download completes, click Restart Now to apply the update immediately, or Later to apply it automatically the next time the app is closed and reopened.
- Click Not Now at any point before downloading to dismiss the dialog. The orange button remains visible so you can return to it later.
Using the App
1. Select or add a server
- Use the left utility sidebar for server controls.
- The same utility sidebar and server controls are available on both Observer and Simulation pages.
- The current server selector is shown at the top-left; click it to open the server picker.
- Use the text-only Expand sidebar / Collapse sidebar control directly under the server selector.
- Click a server to select it and connect immediately.
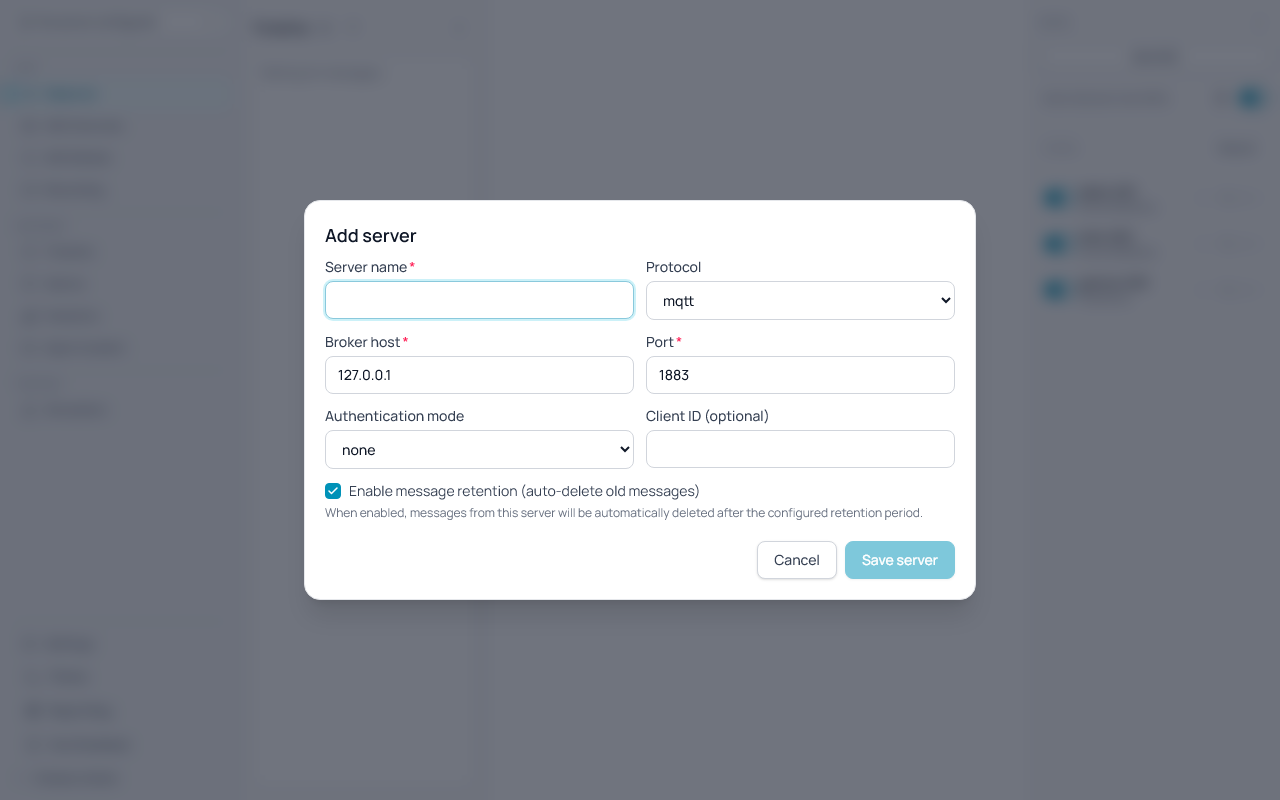
- Click Add server in the picker to open the server creation dialog.
- In the picker, each server row shows:
- server name
- server IP/host and port
- a lock icon for secure (
mqtts) connections - a connection-status dot with colors:
- green = connected
- orange = idle (not connected yet)
- red = connection error
- When the sidebar is collapsed, a PC icon is shown with the same connection-status dot.
- In the dialog, configure:
- protocol:
mqttormqtts - host and port
- optional client ID
- authentication mode:
none(no credentials)basic(username/password)certificate(client certificate and key; requiresmqtts)
- for certificate mode: optional CA certificate and strict certificate validation toggle
- Enable message retention checkbox (default: on) — when unchecked, messages from this server will never be automatically deleted by the retention policy
- protocol:
- Click Save server to save the server and add it to the sidebar. The Save server button is disabled until a server name is provided.
- Validation for server configuration is enforced by the backend; validation messages are shown in the dialog if a save fails.
Delete a server
- Open the server picker by clicking the server selector in the sidebar.
- Each server row has an × (cross) button on its right edge.
- Click the × button to open a confirmation dialog.
- Click Delete to confirm deletion, or Cancel to keep the server.
- If the server being deleted is currently connected, it will be disconnected automatically before removal.
- All associated data is permanently removed from both the database and disk: MQTT messages, discovered AGVs, VDA state, recording layouts (including background images), and LIF files. LIF files shared with recording layouts from other servers are preserved.
- When a server is deleted, the app automatically selects the next available server (or clears the selection if none remain).
2. Connect to a broker
- Click a server in the picker list.
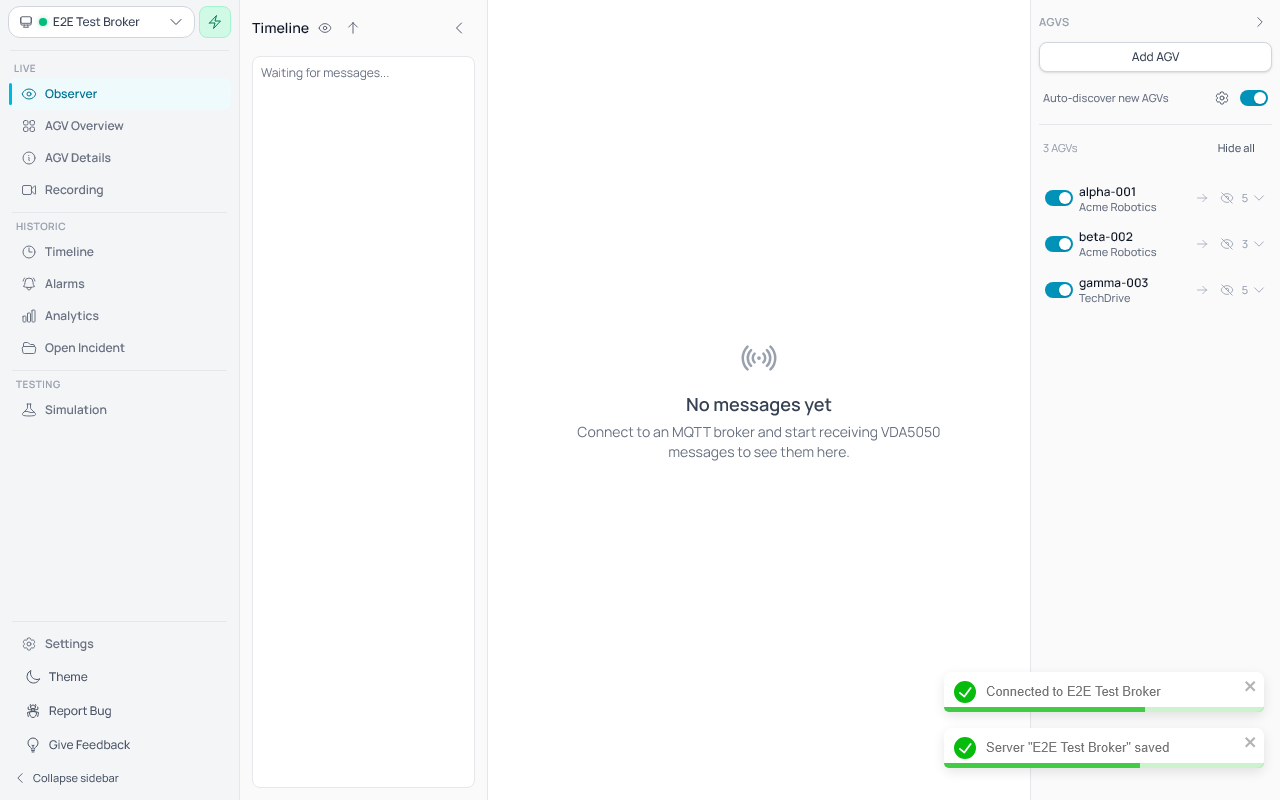
- The status area shows whether you are connected.
3. Monitor messages
- Incoming VDA5050 messages appear in the VDA5050 messages panel.
- Messages are shown with timestamp, topic, and payload.
- The message panel scrolls when many messages arrive.
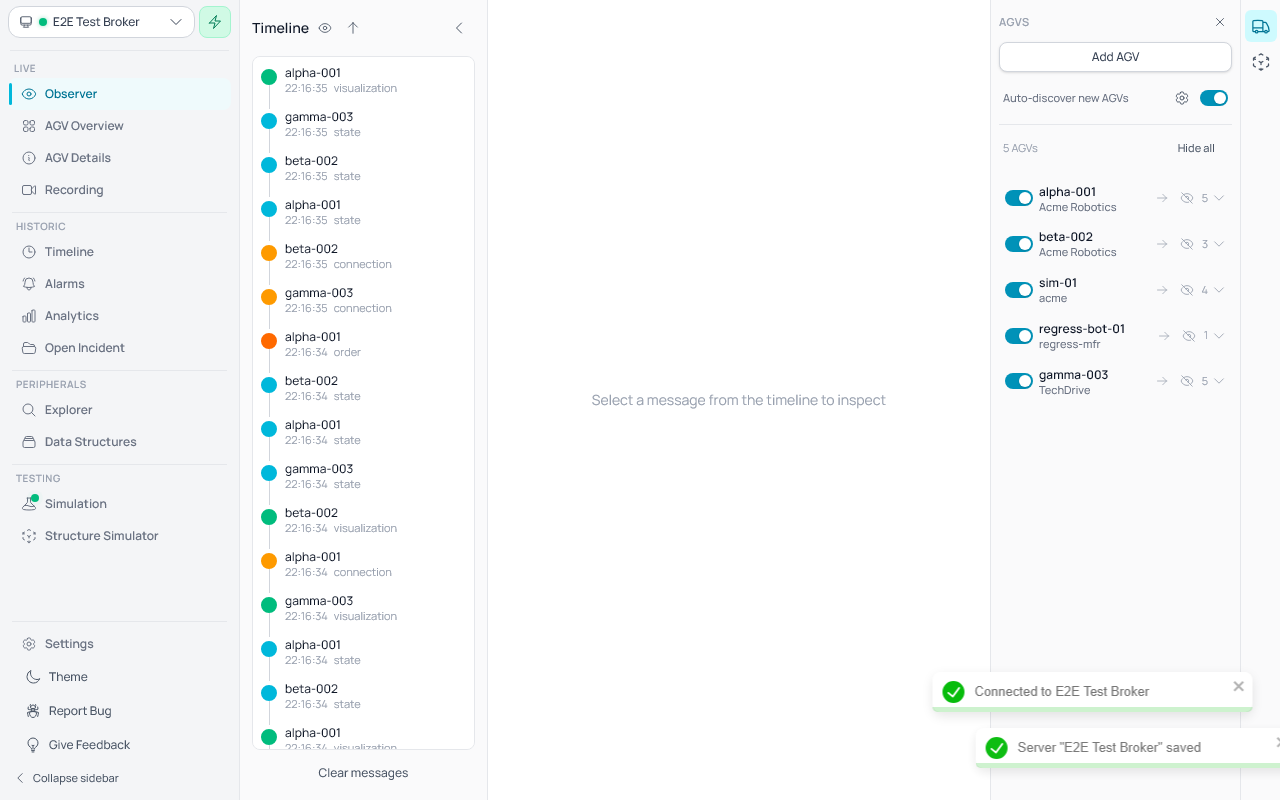
3b. Use AGV/topic sidebar controls
- A second sidebar on the right lists AGVs discovered automatically from topics matching either
uagv/<version>/<manufacturer>/<serial>/<topic>(v1.x / v2.x) orvda5050/<version>/<manufacturer>/<serial>/<topic>(v3.0+). - Use Auto-discover new AGVs to enable or disable discovery of previously unknown AGVs.
- When auto-discovery is disabled, messages from AGVs that are not already known are ignored.
Auto-discovery topic template
- Click the gear icon () next to the auto-discovery toggle to open the Auto-Discovery Settings dialog.
- The dialog lets you customise the MQTT topic template used for AGV discovery.
- The default user-configurable template is
uagv/v{version}/{manufacturer}/{serialNumber}(legacy v1.x / v2.x). The v3.0 rootvda5050/v{version}/{manufacturer}/{serialNumber}is also always recognised — both prefixes are matched against every incoming topic, so v3 fleets are picked up automatically without changing the template. - Available placeholders (same as custom AGV):
{version}— VDA interface version (e.g.2.0){manufacturer}— AGV manufacturer identifier{serialNumber}— AGV serial number
- The template must contain
{manufacturer}and{serialNumber}placeholders. - A Preview section shows:
- The derived MQTT subscription patterns (e.g.
uagv/+/+/+/#andvda5050/+/+/+/#). - An example topic and how it would be parsed.
- The derived MQTT subscription patterns (e.g.
- Click Save to apply the template. Changes take effect on the next broker connection.
- Click Reset to default to restore the default template.
- Example custom templates:
fleet/{manufacturer}/{serialNumber}— for brokers using afleet/prefix.robots/{manufacturer}/{serialNumber}— for brokers without version segments.
- Each discovered AGV is shown as a compact single-line row with:
- A visibility checkbox on the left — controls whether messages from this AGV are displayed.
- The AGV name displayed as two clickable parts: manufacturer (dimmed) and serial number (bold), separated by a
/.- Click the manufacturer name to show only AGVs from that manufacturer (hides all other AGVs' messages).
- Click the serial number to show only that specific AGV (hides all other AGVs' messages).
- A topic count and chevron on the right to expand/collapse the detail panel.
- A dismiss button ( eye-slash icon) that appears on hover — hides the AGV from the sidebar entirely.
View all / Hide all
- When discovered AGVs exist, a "View all" / "Hide all" checkbox row appears above the AGV list.
- View all: checks all visible (non-dismissed) AGVs, making their messages visible. Also clears any per-topic filters.
- Hide all: unchecks all visible AGVs, hiding their messages from the display.
- The checkbox shows an indeterminate state when some but not all AGVs are checked.
Dismissing AGVs
- Hover over a discovered AGV row to reveal the dismiss button ( eye-slash icon) on the right.
- Click it to hide the AGV from the sidebar, reducing clutter.
- Dismissed AGVs automatically reappear when:
- A new MQTT message is received from that AGV.
- The Timeline page loads historical messages from that AGV.
- When one or more AGVs are dismissed, a "Show hidden (N)" button appears at the bottom of the AGV list. Click it to reveal all dismissed AGVs at once.
- Dismissed state is in-memory only and resets when the application restarts.
- Custom AGVs cannot be dismissed (use the delete button instead).
AGV visibility (checkbox)
- Checked: messages from this AGV are included in the message list.
- Unchecked: messages from this AGV are hidden from the display (still received).
- When some but not all topics are visible, the AGV checkbox shows an indeterminate state.
- Checking the AGV checkbox when indeterminate or unchecked makes the AGV and all its topics visible.
Expanded detail panel (chevron)
-
Click the chevron or topic count to expand/collapse the detail panel.
-
The expanded panel shows:
- Per-topic checkboxes: each discovered topic (e.g.
state,order,visualization) has its own visibility checkbox. Unchecking a topic hides only messages of that topic type from the display. - Process messages switch: a slider/switch that controls whether incoming messages from this AGV are processed at all. When set to off, new messages from the AGV are discarded on arrival (not stored). When set to on (default), messages are received and processed normally.
- Per-topic checkboxes: each discovered topic (e.g.
-
Discovery is automatic while messages are received; AGVs appear as soon as matching topics arrive.
-
Discovered AGVs are persisted to the database automatically. When the application is restarted, previously discovered AGVs are restored and appear in the sidebar immediately — even before a broker connection is established.
Adding custom AGVs
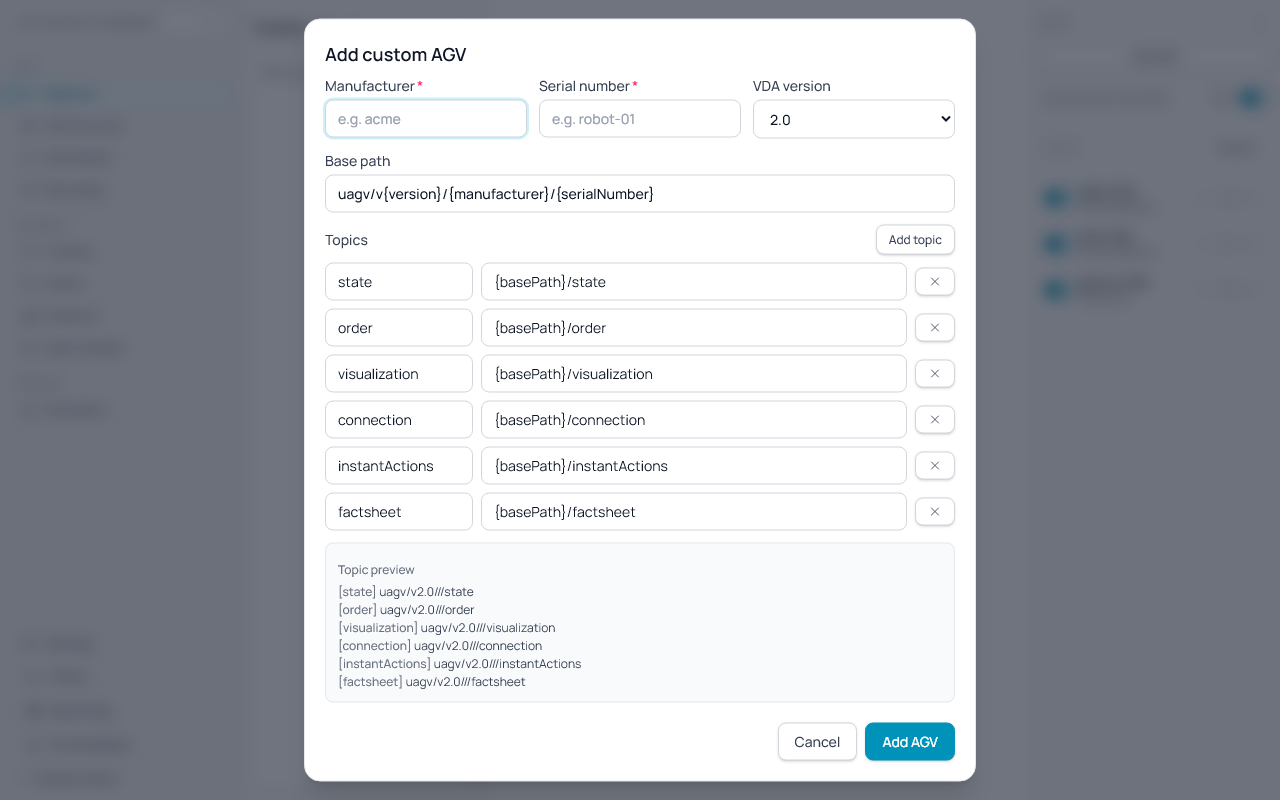
- Click Add AGV (secondary button) at the top of the right sidebar to open the add custom AGV dialog.
- In the dialog, fill in:
- Manufacturer: the AGV manufacturer name (e.g.
acme). - Serial number: the AGV serial number (e.g.
robot-01). - VDA version: select the VDA5050 version (
1.1,2.0,2.1, or3.0). Default topics change based on the selected version — for example,factsheetis available from v2.0, andzoneSetandresponsesare available from v3.0. - Base path: uses wildcard placeholders
{manufacturer},{serialNumber}, and{version}in a template (default:uagv/v{version}/{manufacturer}/{serialNumber}). Wildcards are resolved dynamically and can be placed anywhere in the string. The resolved path is shown below the field. The template can be fully customised. - Topics: each topic has a type and a path. The type field is a combobox with suggestions from the VDA spec but also accepts custom values. The type identifies the topic for later analysis even if the path is customised. The path uses a
{basePath}wildcard (default:{basePath}/state) that is resolved to the base path value; the wildcard can be placed anywhere in the path string. Default topics are pre-filled based on the selected VDA version. - Use Add topic to add additional topic fields.
- Use the ✕ button next to a topic to remove it.
- Manufacturer: the AGV manufacturer name (e.g.
- A Topic preview section shows the full resolved topic paths with type labels (e.g.
[state] uagv/v2.0/acme/robot-01/state). - Click Add AGV to save the custom AGV. It is persisted to the database and appears in the sidebar with a cyan highlight and a
customlabel. - Custom AGVs can be removed by clicking the ✕ delete button on their card. Deletion is a soft delete — the record is hidden from the sidebar but preserved for later analysis.
3c. Use the message timeline
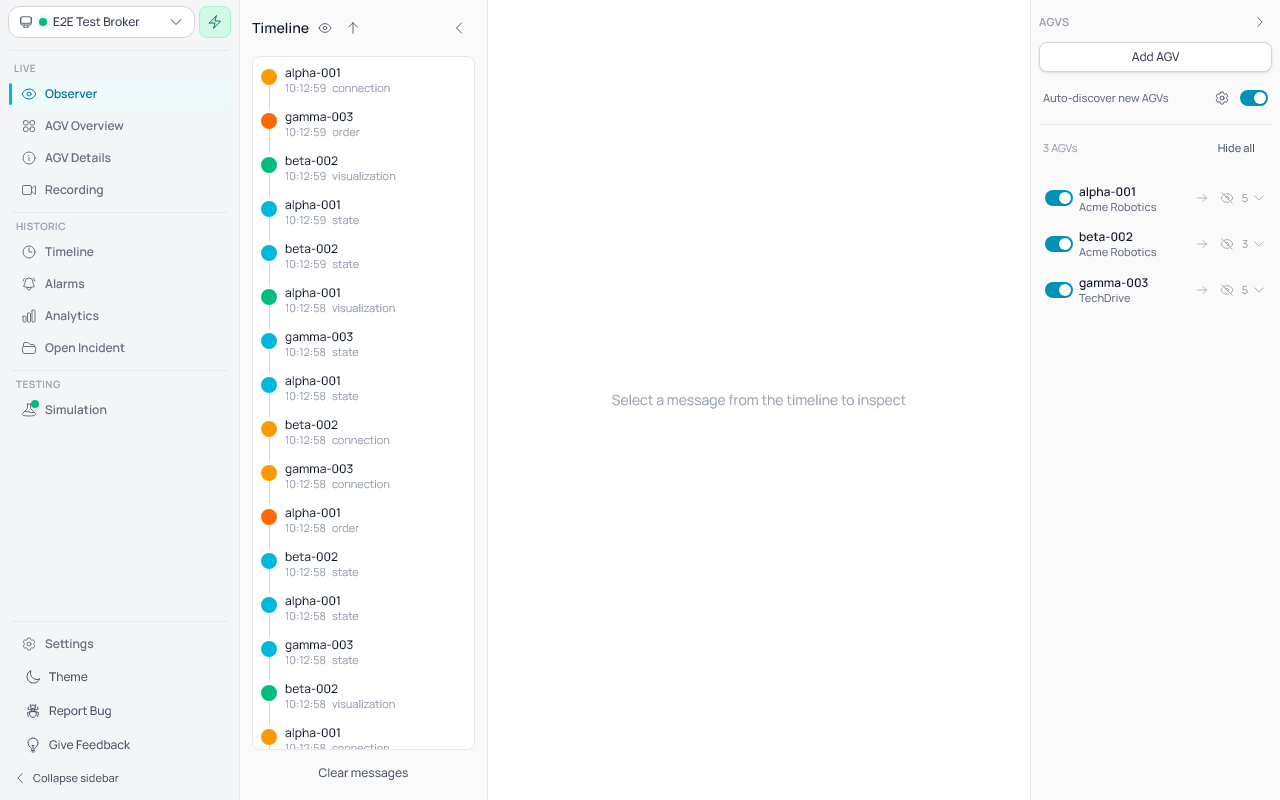
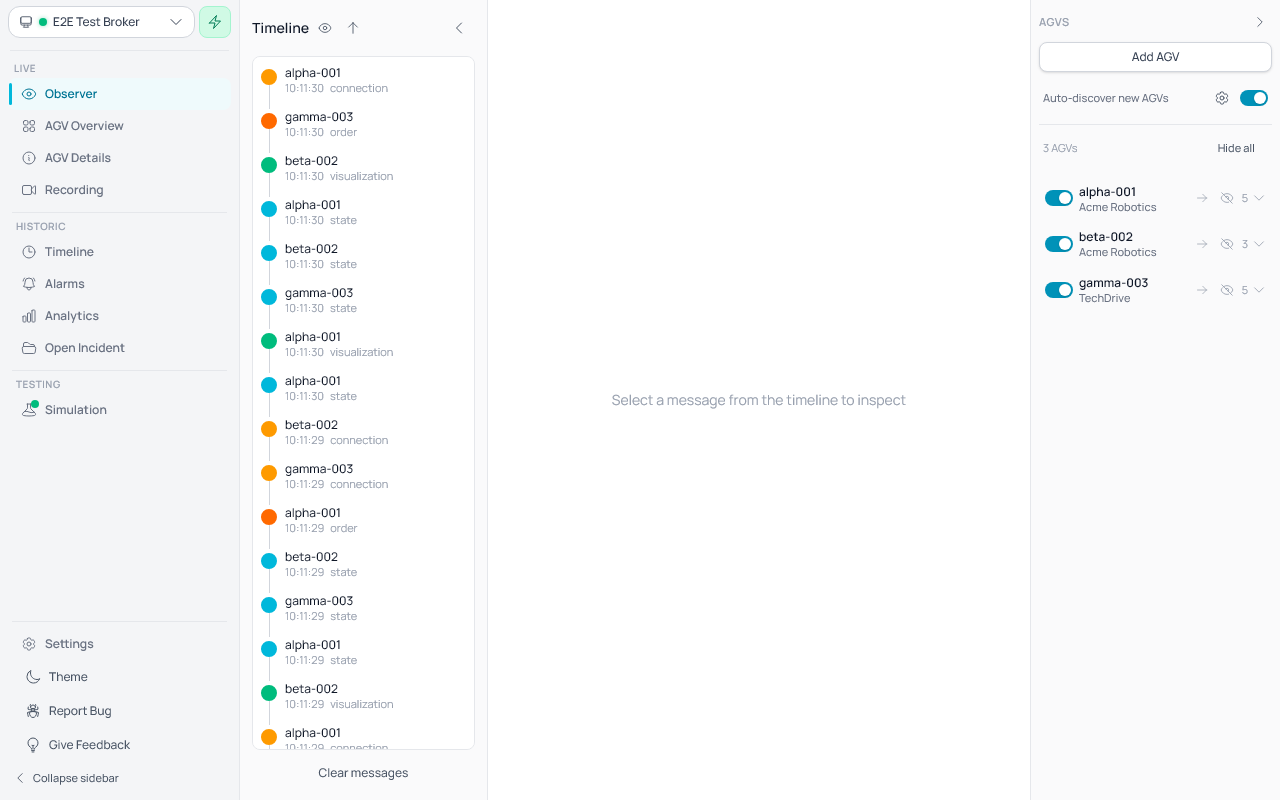
- On Observer, a timeline panel is displayed between the left utility sidebar and the main content area.
- The timeline shows incoming messages as a vertical sequence with colored bubbles.
- In expanded mode, each timeline entry displays topic and timestamp.
- Use the timeline collapse control to switch to compact mode.
- In compact mode, the timeline shows only the vertical line and colored message bubbles.
- When you select a message, next/previous navigation buttons (▲/▼) appear in the detail view next to the topic metadata. These let you jump to the next newer or older message on the same AGV and topic, making it easy to follow a single AGV's state changes over time.
- Topic filter persistence: Topic filter selections (via the eye icon) are remembered when you navigate away and return. Each view (Observer and Timeline) maintains its own independent filter. Filters reset when the application is restarted.
- Reset filter: When one or more topics are hidden, a Reset link appears inside the filter popup next to "Show topics". Clicking it restores visibility for all topics in the current view.
3d. Use the Timeline page (historic messages)
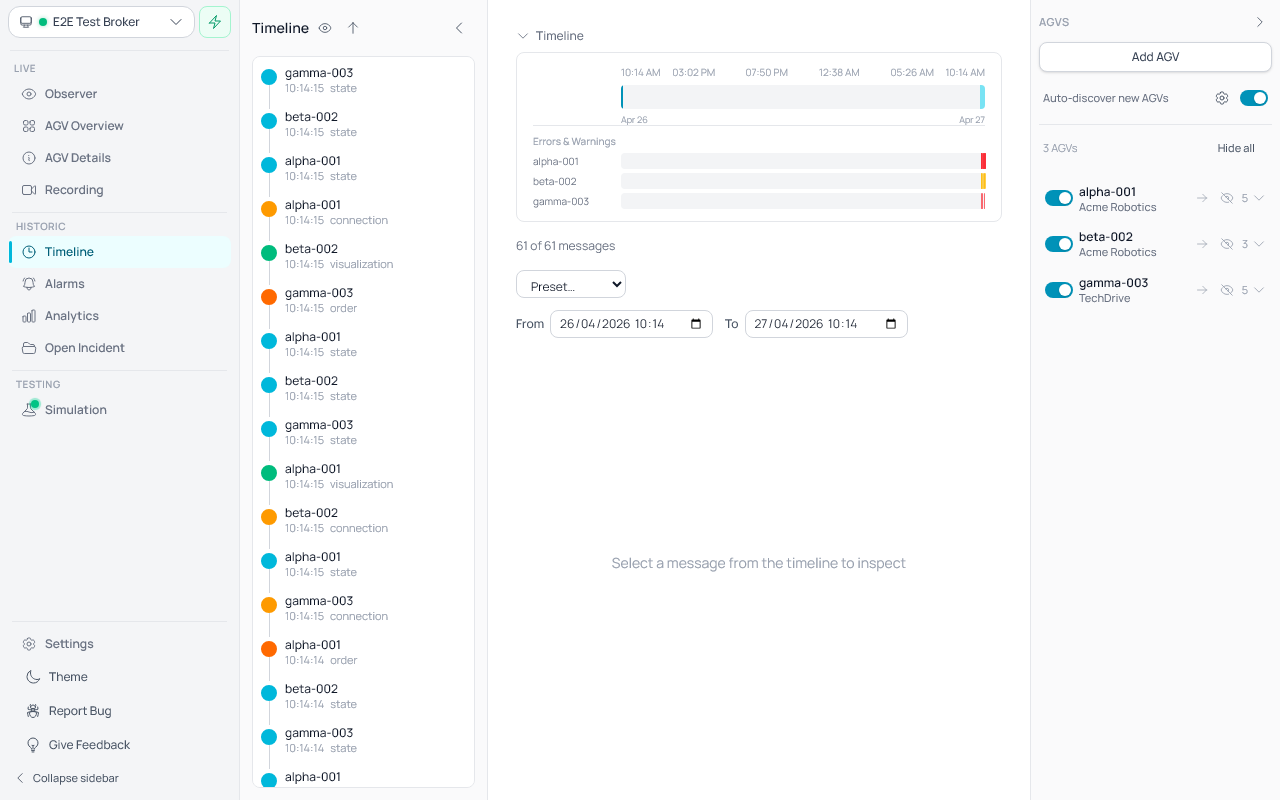
- Navigate to the Timeline page from the left sidebar ( clock icon).
- The Timeline page lets you browse stored historic messages from the database.
- A horizontal timeline bar at the top shows:
- Time tick marks across the selected date range.
- A density visualization showing message concentration across time (cyan bars). The density always reflects the full date range, even when only a subset of messages is loaded in the sidebar.
- A position indicator (vertical cyan line) showing your current position when a message is selected.
- Click anywhere on the density bar to jump to that point in time. The message list reloads starting from the clicked timestamp, so you can explore any part of the date range without scrolling through everything. Subsequent scrolling loads older messages from that point.
- Date range filter below the timeline bar:
- Use the From and To datetime inputs to select a time window.
- Default range is the last 24 hours.
- Enable the Live toggle to switch to real-time mode — new messages from the broker appear as they arrive.
- When Live mode is on, date inputs are disabled.
- A message timeline sidebar (same as Observer) on the left displays individual messages with:
- AGV serial number on each message, identifying which AGV the message came from.
- Color-coded bubbles by topic type (cyan = state, orange = order, etc.).
- Topic type label (state, order, visualization, connection, etc.) displayed alongside the timestamp.
- Error and warning counters on state messages (red badge for errors, amber badge for warnings).
- Topic filtering via the eye icon.
- Virtual scrolling for efficient rendering of large message sets.
- Infinite scroll — the initial batch of messages loads automatically, and older messages are fetched progressively as you scroll down. A "Loading more..." indicator appears while the next batch is being retrieved.
- The status bar below the timeline shows how many messages are currently loaded out of the total (e.g. "500 of 3,200 messages"). The count updates as more messages load.
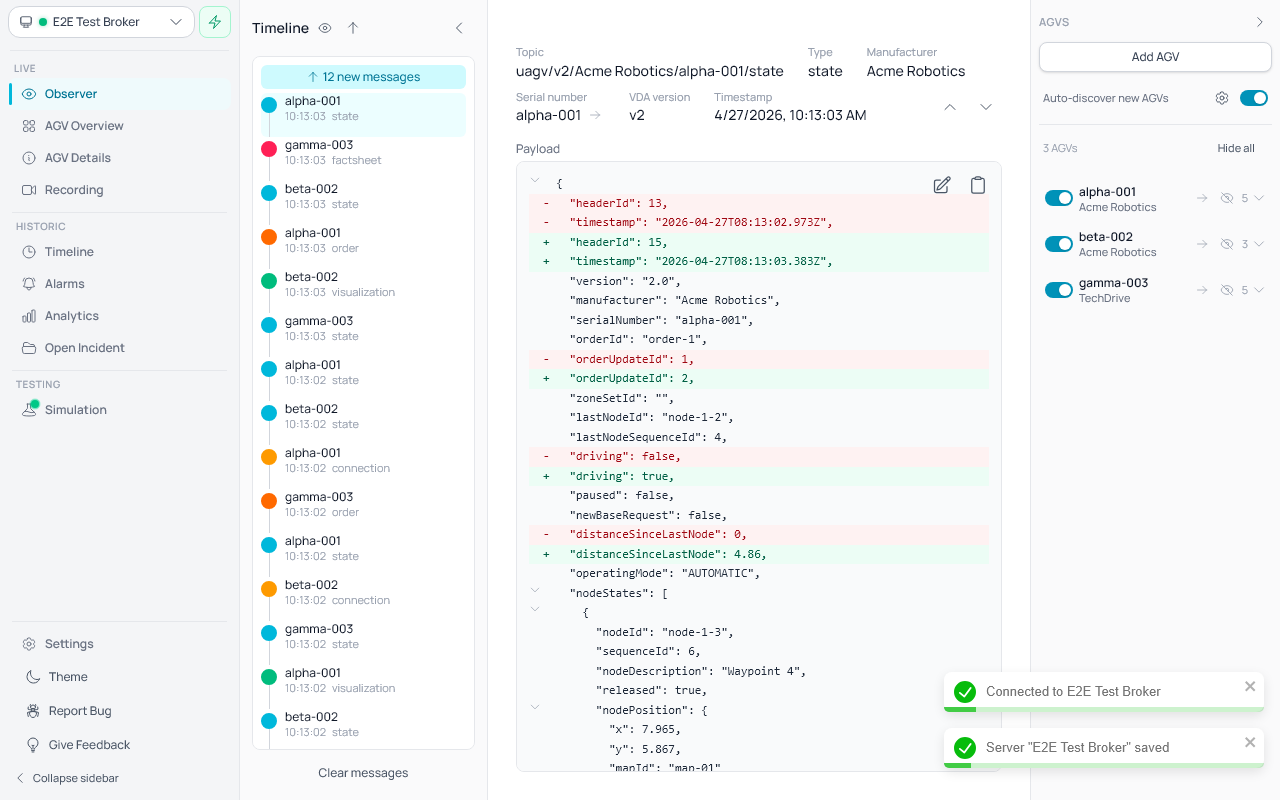
- Click a message to inspect its full payload in the detail view on the right, with:
- Topic metadata (type, manufacturer, serial number, timestamp).
- Next/Previous navigation buttons (▲/▼) appear next to the metadata, allowing you to jump to the next newer or older message on the same AGV and topic without returning to the sidebar.
- JSON payload with diff highlighting against the previous message on the same topic — added lines in green, removed lines in red.
- A diff overview ruler (see below) for quickly spotting and jumping to changes.
- Search within payload (Ctrl+F / Cmd+F).
- The AGV sidebar on the right allows filtering which AGVs' messages are displayed.
Diff overview ruler
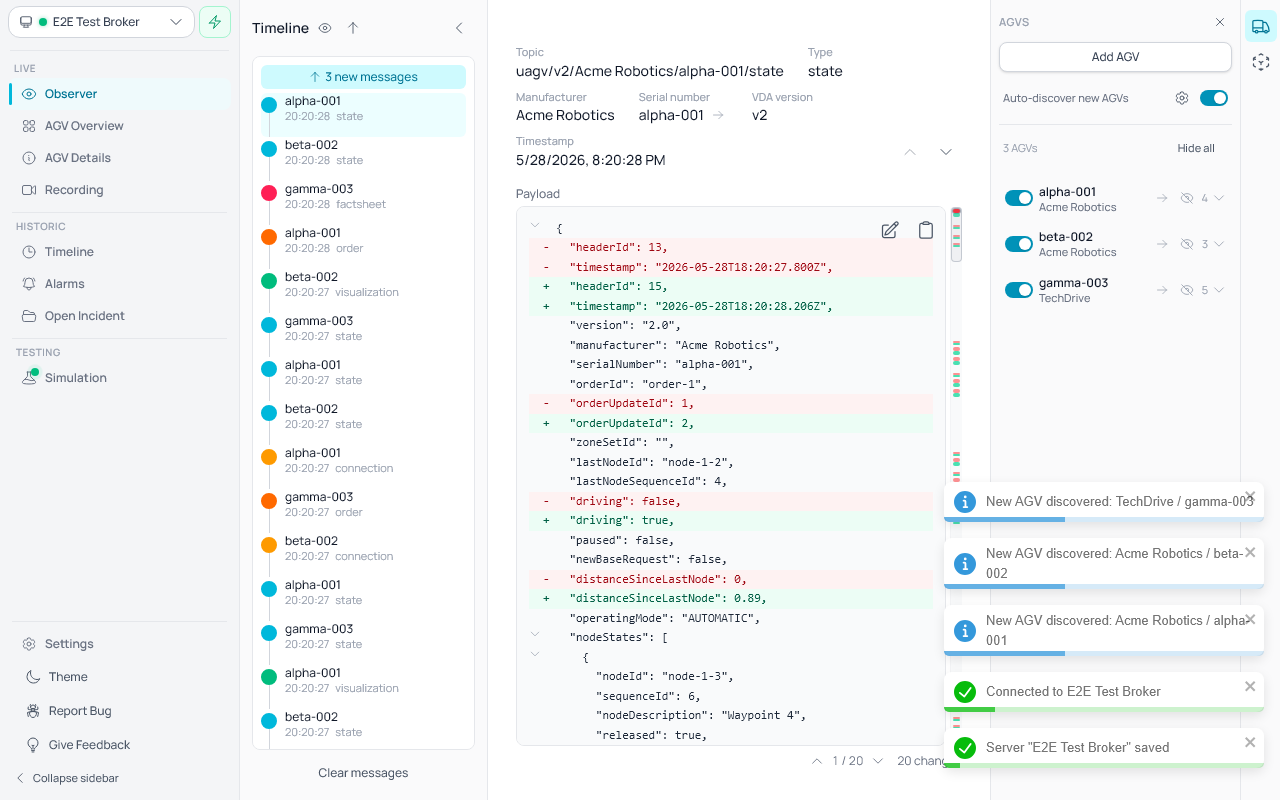
When a message is being compared against a previous message on the same topic, a thin overview ruler appears along the right edge of the payload, beside the scrollbar. It works like the change markers in a code editor:
- Green and red markers show where lines were added or removed across the whole payload — so you can tell at a glance whether anything changed, even in a long
stateorordermessage that doesn't fit on screen. - A translucent viewport box indicates which part of the payload is currently visible; it moves as you scroll.
- Click anywhere on the ruler to jump to that position in the payload.
- Below the payload, Previous (▲) / Next (▼) change buttons step through each change in turn, scrolling it into view. A counter (e.g.
2 / 5) shows the current change and the total number of changes. - The ruler and change controls only appear when there is at least one change; a message with no previous version (or with no differences) shows the payload on its own.
3e. Error & Warning Timeline
- The Timeline page automatically tracks VDA5050 errors and warnings as time-range intervals.
- When a VDA state message contains entries in its
errorsarray, the system records when each error started and ended. - Below the density bar, error/warning lanes appear — one horizontal lane per AGV that had errors or warnings in the selected time range.
- Each lane shows colored segments:
- Red segments indicate FATAL errors.
- Amber/yellow segments indicate WARNING-level issues.
- Segment width represents the error duration. If an error is still active (not yet cleared), the segment extends to the right edge of the time range.
- Hover over any segment to see a tooltip with:
- The AGV identifier (manufacturer/serial number).
- The error level (FATAL or WARNING) and error type.
- The error description (if available).
- The time range (start → end, or "ongoing" if still active).
- Error intervals are saved and can be browsed historically by adjusting the date range.
- Click on any error/warning segment to jump to that time — the message list reloads starting from the error's start time, so you can inspect the state messages around when the error occurred.
- The lanes section is hidden when no errors or warnings exist in the selected time range.
3f. Search messages
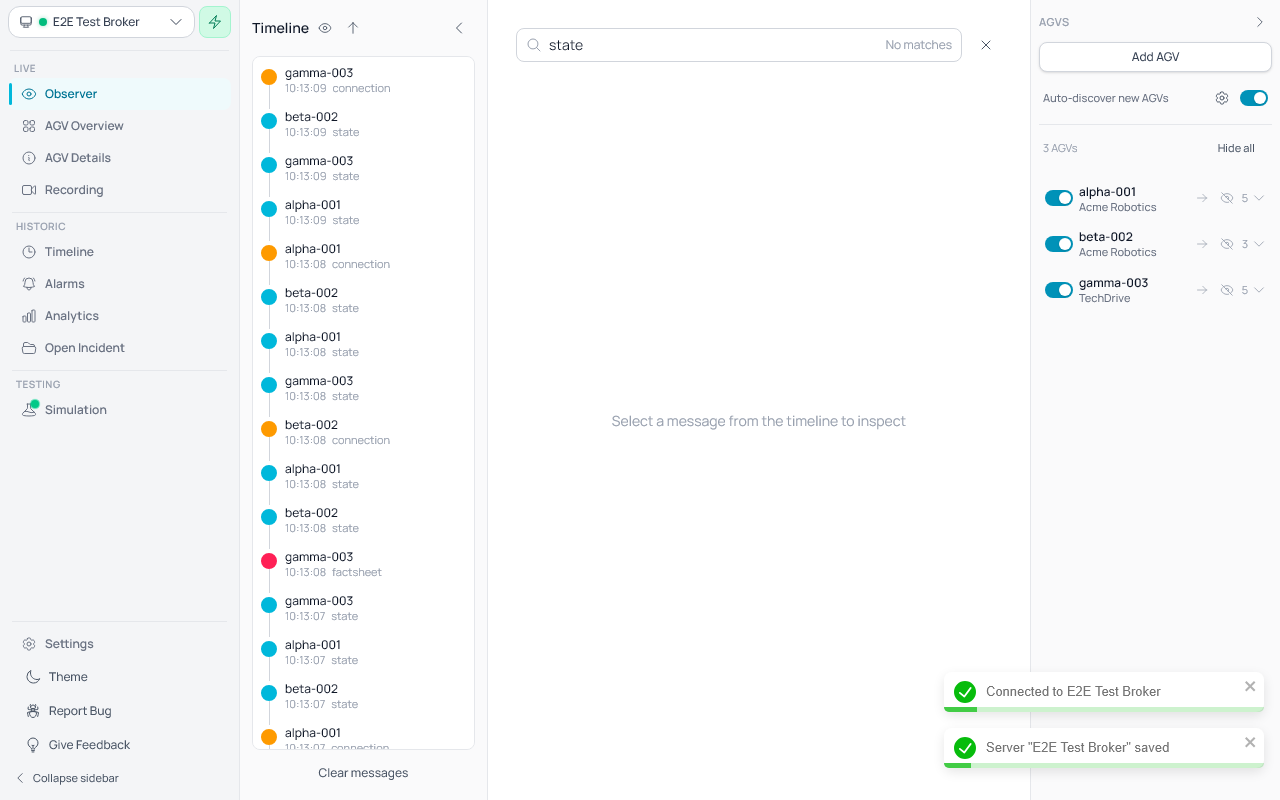
- Press Ctrl+F (Windows/Linux) or Cmd+F (macOS) on the Observer page to open the search bar.
- The search bar slides in above the JSON viewer area.
- Type a search query to filter messages — only messages whose payload or topic contains the search text (case-insensitive) are shown in the timeline.
- The search filter works in addition to existing topic and AGV filters — all filters are applied together.
- Matching text in the JSON payload is highlighted in orange. The currently active match uses a stronger orange with white text.
- A match counter (e.g.
1/3) is displayed in the search bar showing the active match position and total count. - Press Enter to jump to the next occurrence within the payload. The highlight cycles back to the first match after reaching the last one.
- Press Escape or click the ✕ button to close the search bar and clear the filter.
3g. Generate test messages (simulator)
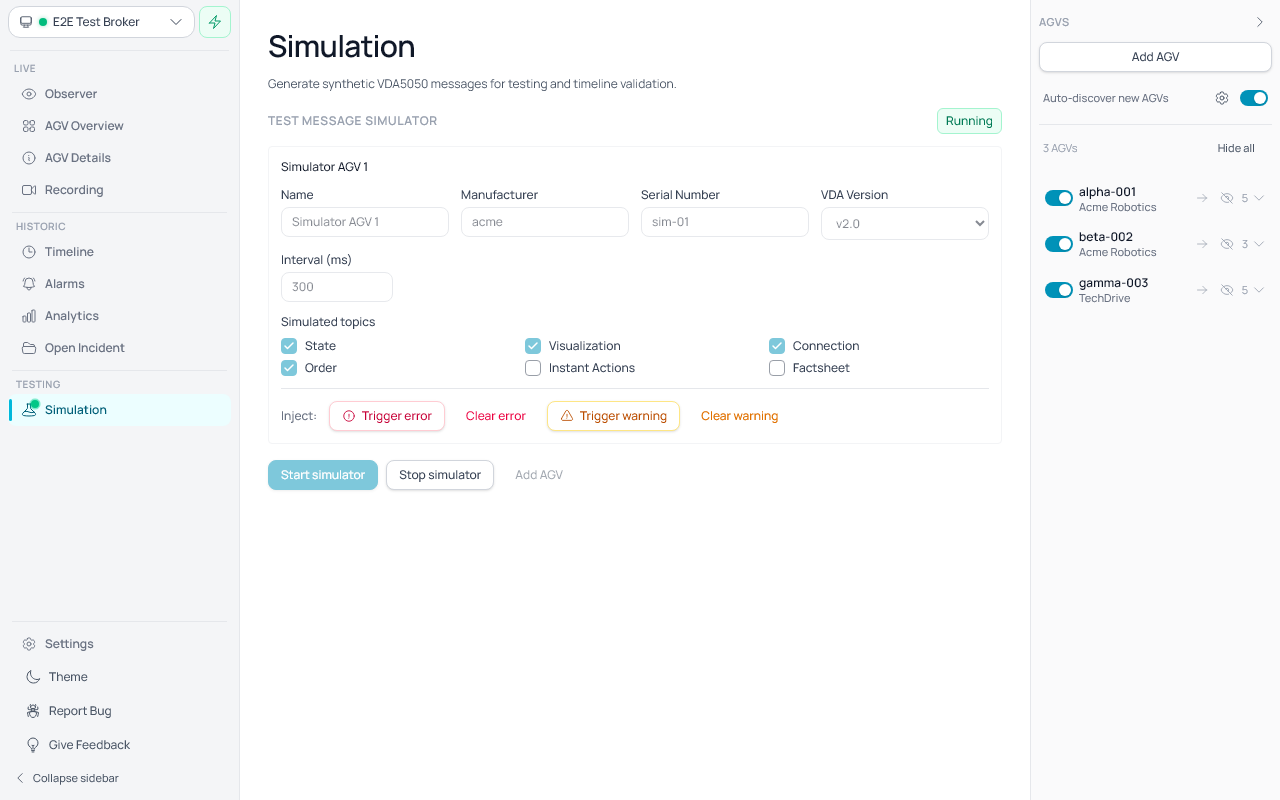
- Open the Simulation page from the left sidebar.
- Use Test message simulator there.
- Configure one or more simulated AGVs:
- Each AGV card has fields for Name, Manufacturer, Serial Number, VDA Version, and Interval (ms).
- VDA Version selects which VDA 5050 protocol version the simulated AGV uses. Available versions: 1.1, 2.0, 2.1, 3.0. The version controls the MQTT topic path:
uagv/v{n}/…for v1.x / v2.x andvda5050/v3/…for v3.0+ (per VDA 5050 v3 §4.2). The header'sversionfield tracks the same value. - Click Add AGV to add another simulated AGV. Click Remove on an AGV card to remove it (at least one must remain).
- Default AGV name follows the pattern "Simulator AGV 1", "Simulator AGV 2", etc.
- Select which topic types to simulate per AGV using the checkboxes under Simulated topics:
- Available topics depend on the selected VDA version: v1.1 offers State, Visualization, Connection, Order, Instant Actions. v2.0/2.1 adds Factsheet. v3.0 adds Zone Set and Responses.
- By default, State, Visualization, Connection, and Order are enabled. Other topics are disabled by default.
- Changing the VDA version automatically removes any selected topics that are not available for the new version.
- At least one topic must remain selected per AGV.
- All configuration fields and topic selection are disabled while the simulator is running; stop the simulator to make changes.
- State topic messages are VDA5050 compliant, including all required fields:
orderId,orderUpdateId,lastNodeId,lastNodeSequenceId,driving,operatingMode,nodeStates,edgeStates,agvPosition,velocity,loads,actionStates,batteryState,errors,information, andsafetyState. - Responding to instant actions: The simulator responds to incoming VDA 5050 instant actions:
- factsheet (v2.0+): When the AGV receives a
factsheetinstant action, it publishes a complete factsheet on thefactsheettopic. The factsheet includes version-appropriate default VDA actions inprotocolFeatures.agvActions. - stateRequest: When the AGV receives a
stateRequestinstant action, it immediately publishes its current state. - Both action types update the AGV's
actionStatesthrough the standard VDA 5050 lifecycle (WAITING → RUNNING → FINISHED).
- factsheet (v2.0+): When the AGV receives a
- Click Start simulator to generate synthetic VDA5050 messages for all configured AGVs using their selected topics.
- Click Stop simulator to stop generation.
- Inject errors and warnings while running:
- While the simulator is running, each AGV card shows an Inject section with four buttons.
- Trigger error injects a VDA5050 FATAL-level error into the AGV's state messages. Clear error removes all active errors.
- Trigger warning injects a VDA5050 INFO-level information entry into the AGV's state messages. Clear warning removes all active warnings.
- Multiple clicks on Trigger error or Trigger warning accumulate — each click adds another entry.
- Errors and warnings are independent; clearing one does not affect the other.
- Active error/warning indicators: A red badge with an exclamation-circle icon and count appears next to the AGV name when errors are active. An amber/orange badge with an exclamation-triangle icon and count appears for warnings. The badges update in real time and disappear when the respective faults are cleared or the simulator is stopped.
- This simulator is intended for local testing and timeline validation.
4. Read quick system status
- The top status bar shows:
- selected server
- current connection state
- number of messages currently displayed
5. Use sidebar navigation
- The left utility sidebar contains application navigation links.
- Observer opens the monitoring dashboard.
- Dashboard opens the AGV status dashboard showing a grid of all known AGVs.
- AGV Details opens the per-AGV detail view with status, errors, order path, and instant actions.
- Recording opens the live track recording page, where AGV movements and imported LIF layouts are visualized on a 3D canvas.
- Timeline opens the historic message timeline page.
- Alarms opens the historic error/alarm overview page.
- Analytics opens the usage analytics page.
- Simulation opens a dedicated simulator page.
- The root landing view opens Observer by default.
- In collapsed sidebar mode, navigation links are shown as icons.
- Active navigation links are highlighted in cyan.
- Inactive navigation links are shown in gray.
5b. Use the Alarms page
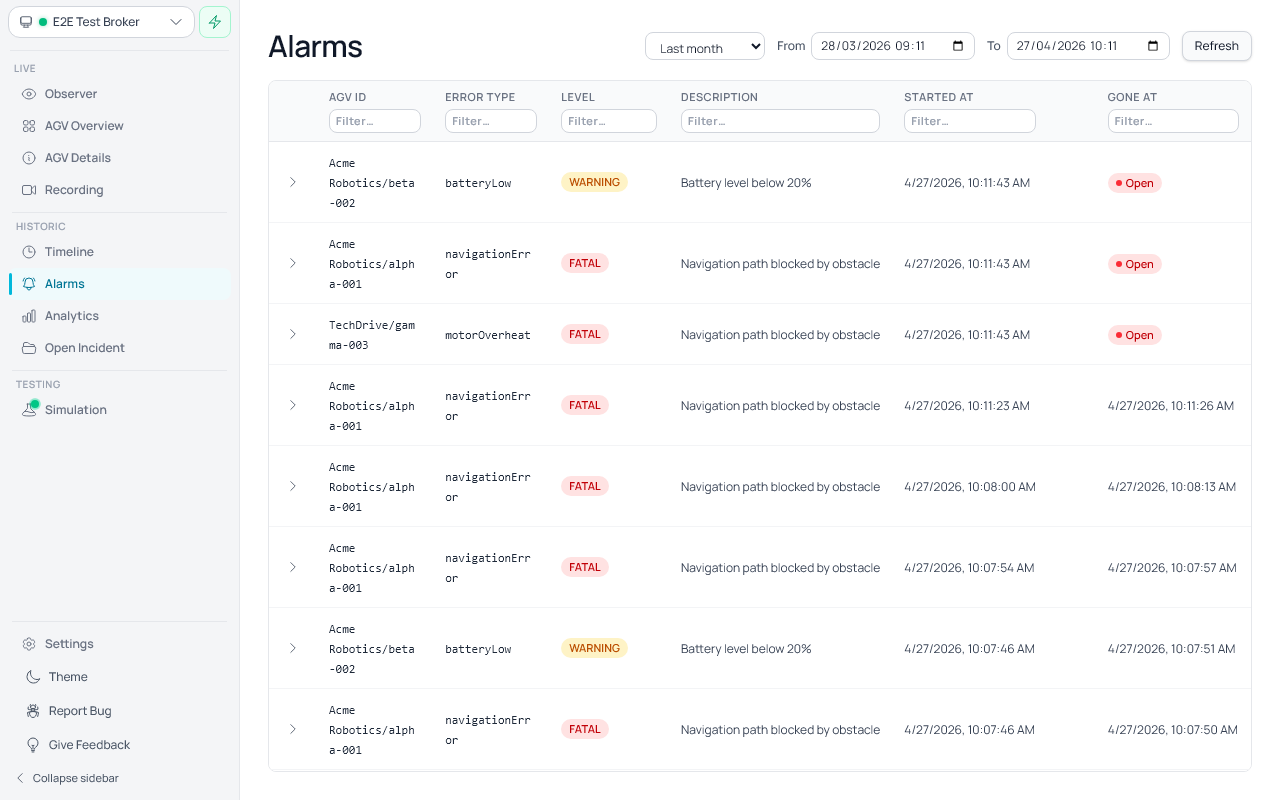
- Navigate to the Alarms page from the Historic section in the sidebar.
- The Alarms page displays a table of all detected VDA 5050 error intervals.
- Open errors (still active) are listed first, sorted by start time (newest first). Gone errors (resolved) appear below, sorted by resolution time.
- Use the time range filter in the top-right to control which errors are shown:
- Select a preset: Last 24 hours, Last week, Last month (default), Last 3 months, or Last year.
- Or set a custom date range using the From and To date/time pickers.
- Each column header has a text filter input. Filters are combined with AND logic (all must match).
- Click any row to expand it and see full error details: AGV ID, error type, level, status, timestamps, description, hint, and references.
- Click the Refresh button to reload the latest data from the backend.
- The table uses virtualized scrolling, so it remains fast even with thousands of alarm records.
5c. Report a bug or give feedback
- At the bottom of the left sidebar, a Utils section contains two buttons: Report Bug and Give Feedback.
- Clicking either button opens a feedback dialog pre-set to the matching type (Bug Report or Suggestion).
- You can switch between types inside the dialog using the toggle at the top.
- Fill in the Title (brief summary) and Description (details) fields, then click Send.
- Feedback is sent to the development team via Discord. A success toast confirms delivery.
- If sending fails, an error message appears in the dialog and your input is preserved so you can retry.
- In collapsed sidebar mode, both buttons are accessible as icon-only buttons.
6. AGV Overview Dashboard
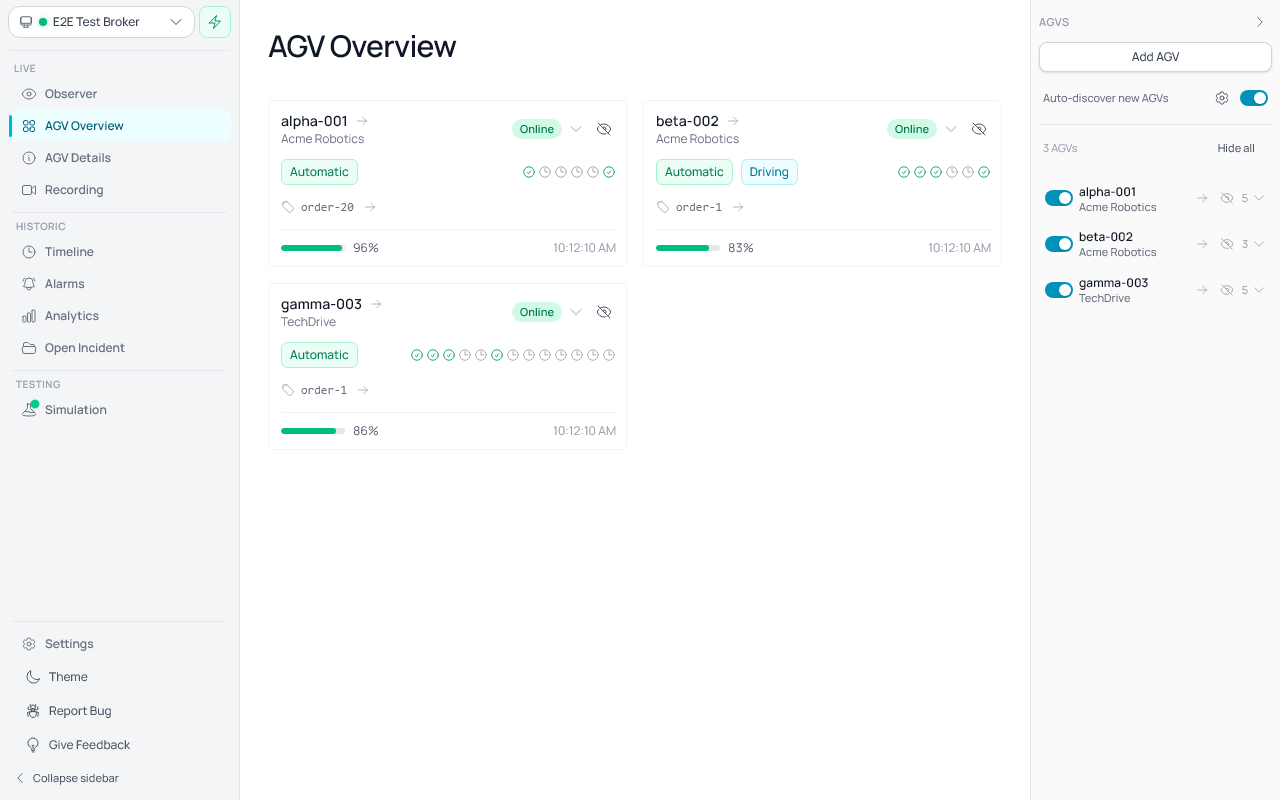
- Open the Dashboard page from the left sidebar navigation.
- The dashboard displays a grid of status cards — one card per known AGV — based on the latest received VDA5050 state messages.
- Cards automatically appear as AGVs are discovered through MQTT messages.
- The grid is responsive, showing at least 3 cards side-by-side on wider screens, with columns adapting to window width.
Each AGV card shows:
- AGV identity: serial number (primary) and manufacturer (secondary).
- Online/Offline status: derived from the latest VDA5050
connectionmessage. If no connection message is available, the AGV is considered online when state messages have been received. - Operating mode:
Automatic,Semi-Auto,Manual,Service,Teach-In, orUnknown. - Driving indicator: a badge appears when the AGV is actively driving.
- Charging indicator: a badge with a bolt icon appears when the AGV's battery is charging.
- Trip ID: the current VDA5050
orderIdis shown with a tag icon when present. - Action state icons: compact icons summarising each active action state from the VDA5050 state message. Hover over an icon to see its label. Each icon represents one action's current status:
- Clock icon (gray) — Waiting
- Circular arrow icon (blue) — Initializing
- Play icon (green) — Running
- Pause icon (amber) — Paused
- Check circle icon (green) — Finished
- X circle icon (red) — Failed
- Error count: number of VDA5050 errors with
errorLevel: FATAL, shown with a red icon. - Warning count: number of VDA5050 errors with
errorLevel: WARNING, shown with an amber icon. - Battery level: a progress bar with color coding (green >50%, amber >20%, red ≤20%) and percentage.
- Last seen: timestamp of the most recent state message.
Expanding a card for action details:
- Click any AGV card to expand it and reveal a detailed action states panel.
- Each action shows its type, current status label, description, and result description (if available).
- Click the card header again to collapse it back to the compact view.
Card border highlights:
- Red border: AGV has one or more FATAL errors.
- Amber border: AGV has warnings but no FATAL errors.
- Default border: AGV has no errors or warnings.
Empty state:
- When no AGVs have been detected, a prompt is shown to connect to an MQTT broker.
Hiding AGVs from the dashboard:
- Each AGV card has a hide button ( eye-slash icon) in the top-right corner of the header.
- Clicking it hides the AGV from the dashboard, the observer, and the AGV sidebar — the same as unchecking the AGV checkbox in the sidebar.
- Hidden AGVs automatically reappear when a new MQTT message is received for that AGV.
- To manually restore all hidden AGVs, use the "View all" checkbox in the AGV sidebar.
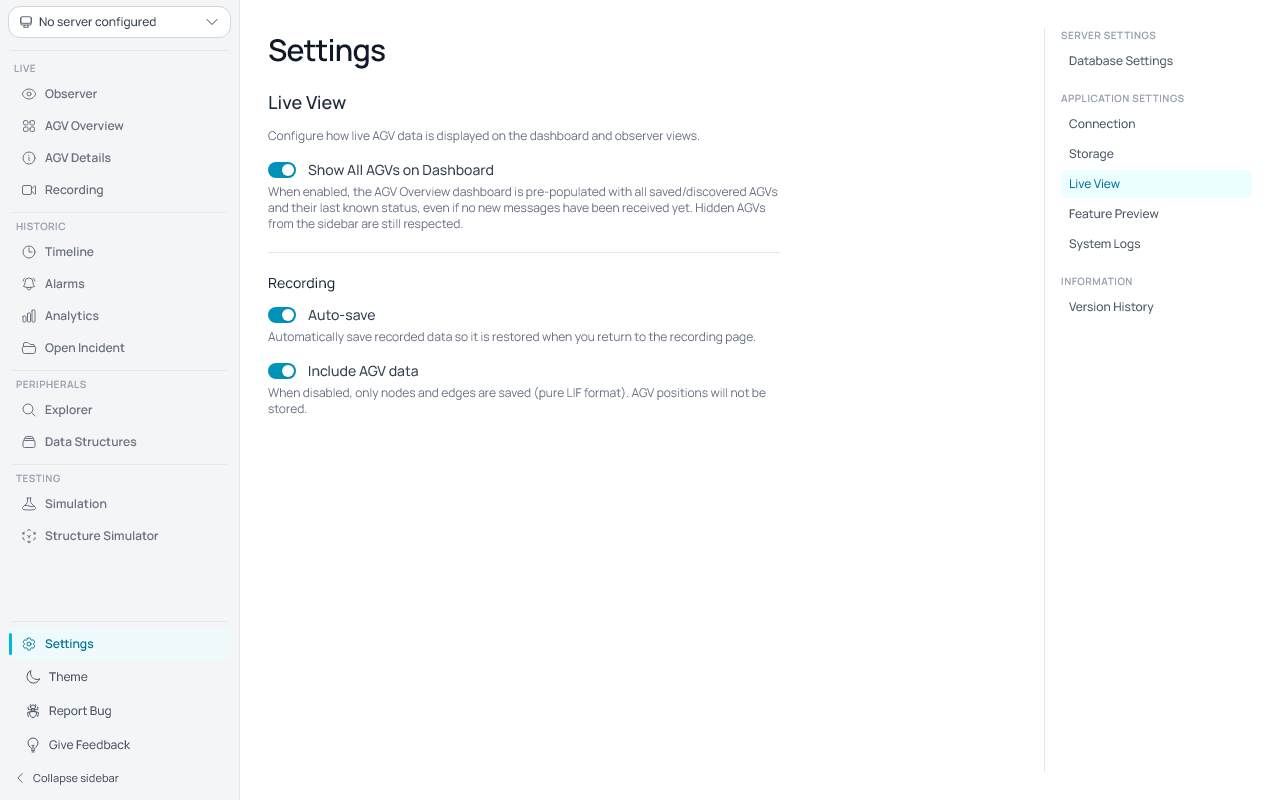
Dashboard: Show All AGVs setting:
- In Settings → Live View, there is a "Show All AGVs on Dashboard" toggle.
- When disabled (default): the dashboard only shows AGVs that have sent messages in the current session.
- When enabled: the dashboard is pre-populated with all saved/discovered AGVs and their last known status, even if no new messages have been received yet. The dashboard list matches the AGV sidebar list.
- In both modes, hidden AGVs (unchecked in the sidebar or hidden via the dashboard eye-slash button) are not shown.
7. Quick-connect/disconnect selected server
- In the expanded sidebar, a small quick-action button appears directly under the selected server name.
- The button uses a spark icon and shows:
- Connect when the selected server is not connected
- Disconnect when the selected server is currently connected
AGV Details
The AGV Details page provides a comprehensive view of an individual AGV's status and capabilities.
Accessing AGV Details
The AGV Details link is always visible in the navigation sidebar. You can also open an AGV's details from:
- Navigation Sidebar — Click AGV Details in the left sidebar. This auto-navigates to the first available AGV. If no AGVs are available, an empty state is shown.
- Dashboard — Click the arrow button next to the AGV name on any AGV Overview card.
- AGV Sidebar — Click the (info) icon next to any discovered or custom AGV.
AGV Selector Sidebar
The AGV Details page has a dedicated sidebar on the right with a searchable dropdown to quickly switch between AGVs:
- Click the dropdown to open a list of all available AGVs (discovered and custom).
- Type in the search field to filter by manufacturer, serial number, or AGV ID.
- Selecting a different AGV immediately navigates to its details page while staying on the same tool page.
- AGVs that are dismissed (hidden via the sidebar eye-slash icon) are excluded from the selector.
- Custom AGVs are marked with a Custom badge.
Sidebar Navigation (Tools)
Below the AGV selector, the sidebar provides navigation links to different tool pages:
- General — Displays general AGV information including connection status, operating mode, battery level, errors, action states, and MQTT topics.
- Order Path — Visualizes the driven and planned path for VDA 5050 orders as a vertical timeline.
- Instant Actions — Send immediate VDA 5050 commands to the AGV with default and custom action presets.
- Danger Zone — Irreversible data management actions: purge AGV data or completely delete the AGV.
Each tool page uses URL-based routing, so you can deep-link to specific pages and use browser back/forward navigation.
General Page
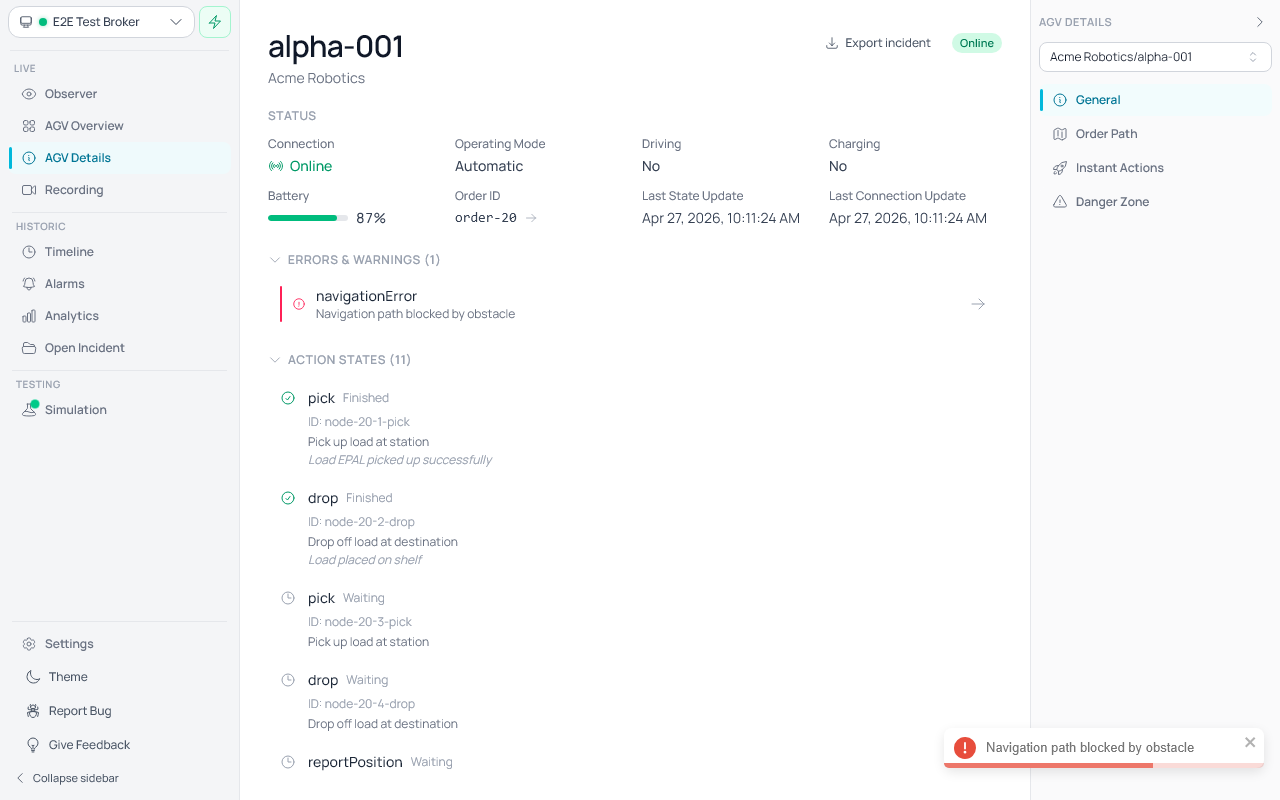
The General page shows:
- Connection status — Online/Offline indicator
- Operating mode — Automatic, Semi-Auto, Manual, Service, or Teach-In
- Driving and charging state
- Battery level — Visual progress bar with percentage
- Current order ID — If the AGV is executing an order
- Errors and warnings — Each active error and warning is displayed individually with its error type, description, and hint (when available). An arrow button on each error navigates directly to the Timeline page, jumping to the timestamp when the error first appeared. If error details have not loaded yet, aggregate counts are shown as a fallback.
- Action states — List of active actions with their execution status (Waiting, Initializing, Running, Paused, Finished, Failed)
- Topics — Discovered MQTT topics for the AGV, or configured topics for custom AGVs
- Timestamps — Last state update and last connection update times
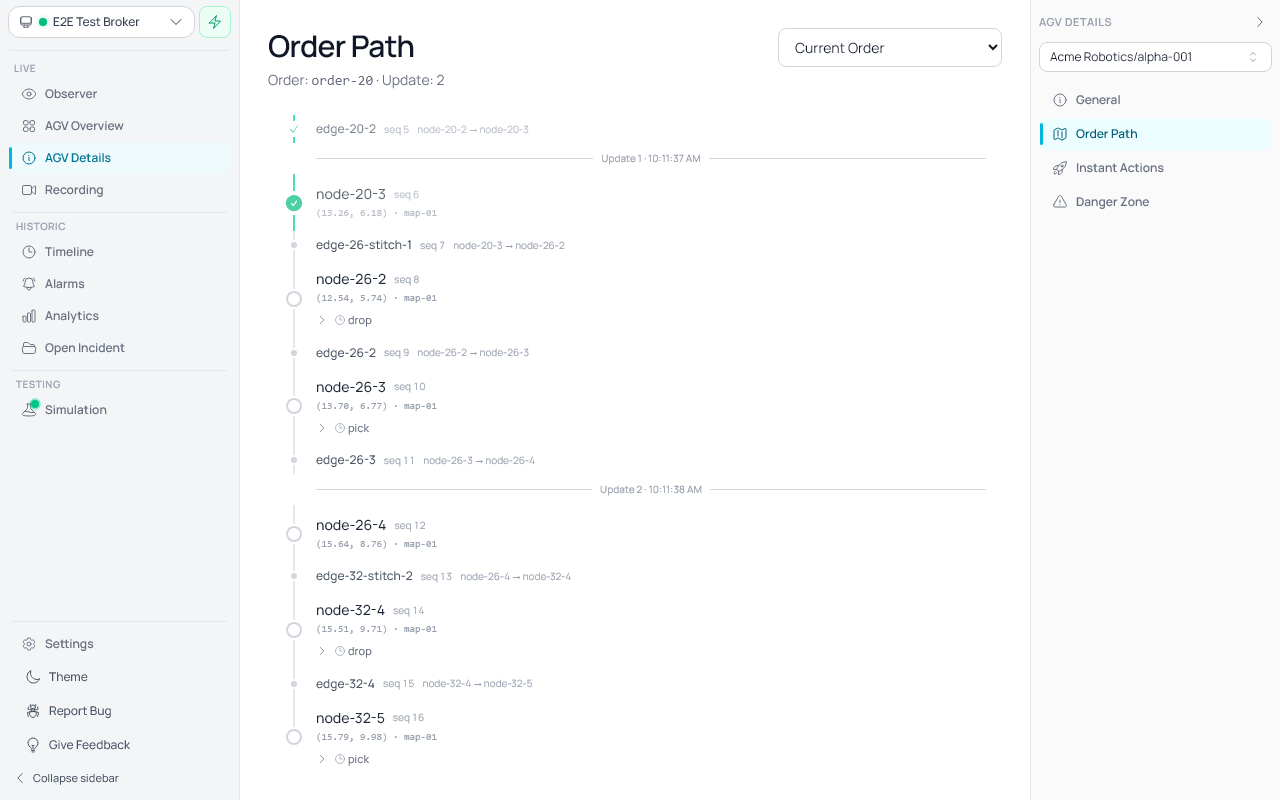
Order Path
The Order Path tool visualizes the sequence of nodes and edges that make up a VDA 5050 order, showing both the driven (completed) path and the planned (upcoming) path for the selected AGV.
Accessing the Order Path:
- Navigate to AGV Details → Order Path in the sidebar tool navigation.
Timeline view:
- The order is displayed as a vertical timeline with nodes and edges listed in sequence from top to bottom.
- Active items (the node or edge the AGV is currently executing) are highlighted with a green border and a spinner indicator.
- Completed items are collapsed into a summary section at the top of the timeline. The last 3 completed items are always visible for context; click "Completed (N more)" to expand and review earlier traversed nodes and edges.
- Upcoming items are listed below the active item, showing the remaining planned path.
Actions:
- Nodes and edges may have associated VDA 5050 actions. Each action's name and status icon are always visible inline (e.g., a clock icon for waiting, play for running, checkmark for finished). Click the action row to expand full details including blocking type, description, parameters, result, and completion timestamp.
Order selector:
- A dropdown at the top of the Order Path page lets you select from available orders for the AGV.
- Use this to review past orders or switch between orders if the AGV has received multiple.
Order updates and stitching:
- VDA 5050 allows the master control to extend or modify an order by sending order updates (same
orderId, incrementedorderUpdateId). The Order Path automatically stitches together all updates for an order, reconstructing the full accumulated path — including nodes from earlier updates that are no longer sent in newer messages. - Order update boundaries are shown as horizontal divider lines in the timeline, labeled with the update ID and timestamp, so you can see where each order update begins in the accumulated path.
- Horizon nodes (unreleased, planned) are shown with a dashed border and reduced opacity to distinguish them from committed base nodes. When a new order update arrives, stale horizon nodes from previous updates are automatically removed — only the current update's horizon is shown, since older estimates are no longer valid.
Completion timestamps:
- Completed nodes, edges, and actions display the timestamp of when they were completed, derived from VDA 5050 state message history. This helps trace AGV progress timing through the order.
Real-time updates:
- The timeline updates in real time as the AGV progresses through the order — completed items move into the collapsed section, and the active indicator advances automatically. Updates are targeted to the specific AGV being viewed, minimizing unnecessary refreshes.
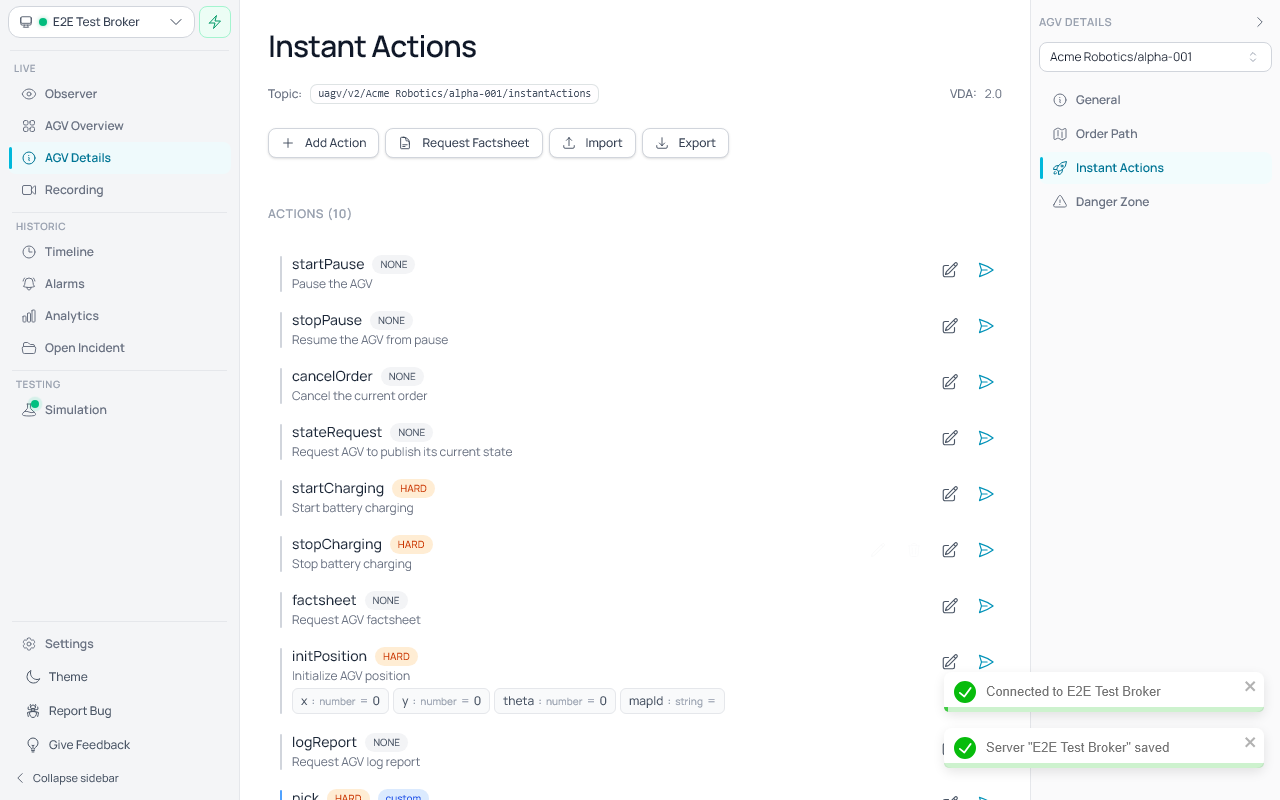
Instant Actions
The Instant Actions tool lets you send immediate VDA 5050 commands (instant actions) to an AGV.
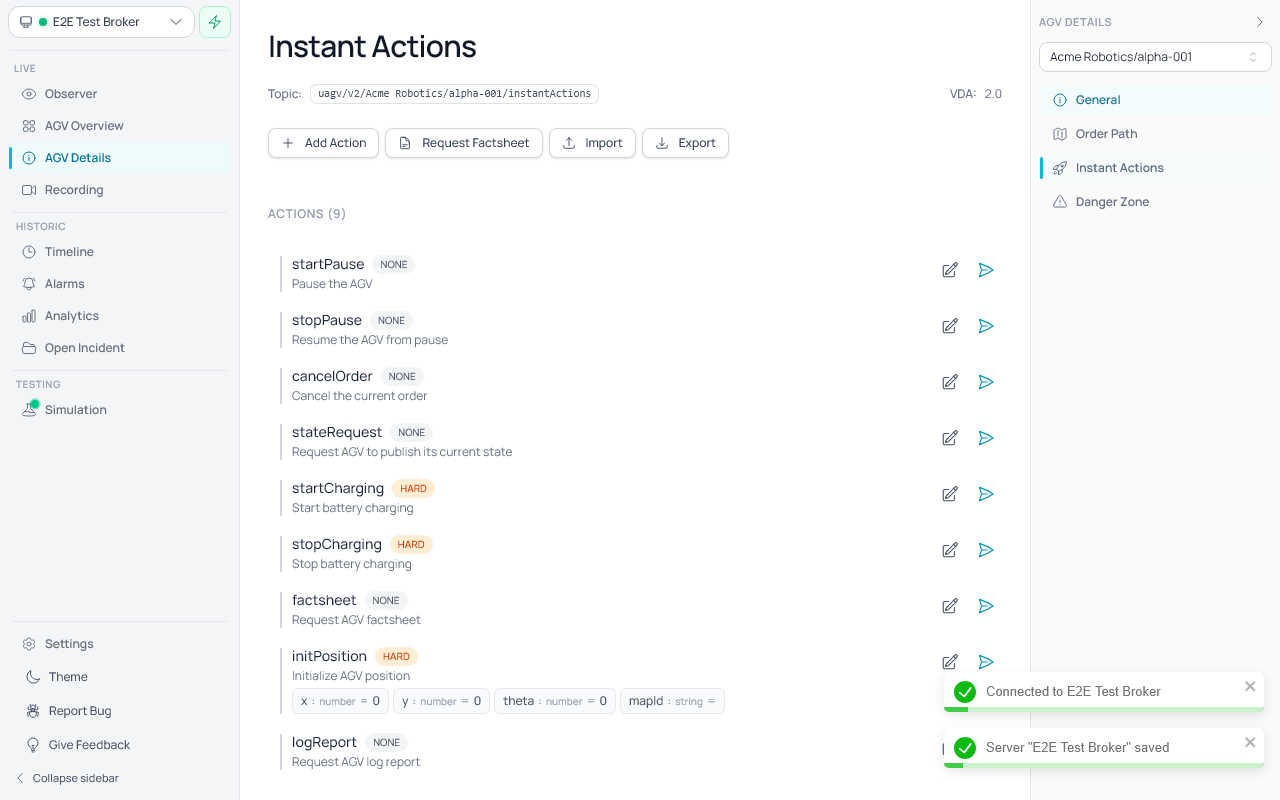
Default VDA 5050 Actions:
When you open the Instant Actions page, a list of default VDA 5050 actions is shown based on the AGV's VDA version:
- v1.1:
startPause,stopPause,cancelOrder,stateRequest - v2.0+: All v1.1 actions plus
startCharging,stopCharging,factsheet,initPosition,logReport
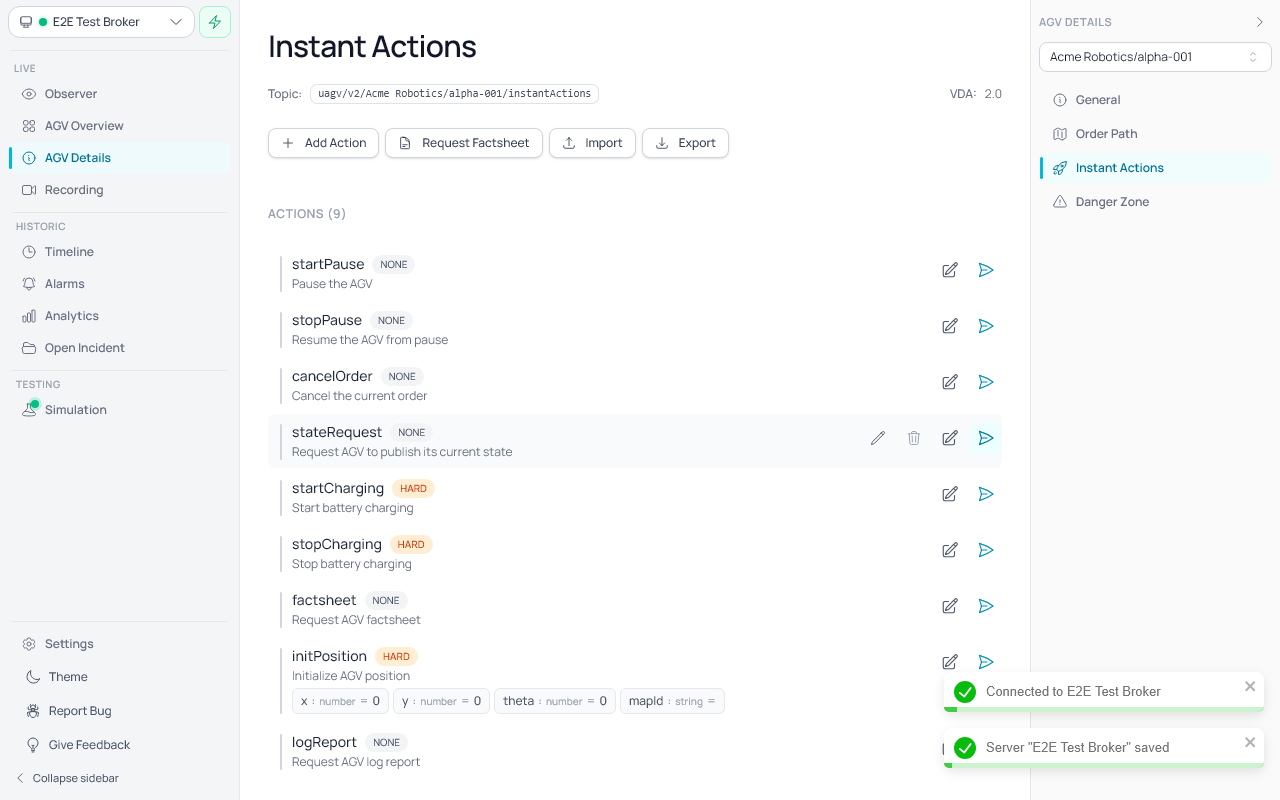
Sending Actions:
Each action row has two send buttons:
- Send ( paper airplane icon) — sends the action immediately with its current parameter values
- Edit & Send ( pencil-square icon) — opens a dialog where you can temporarily override parameter values before sending; changes are not saved to the original action
The topic path is resolved automatically from the AGV's configuration (custom AGVs use their configured path; discovered AGVs use the auto-discovery template).
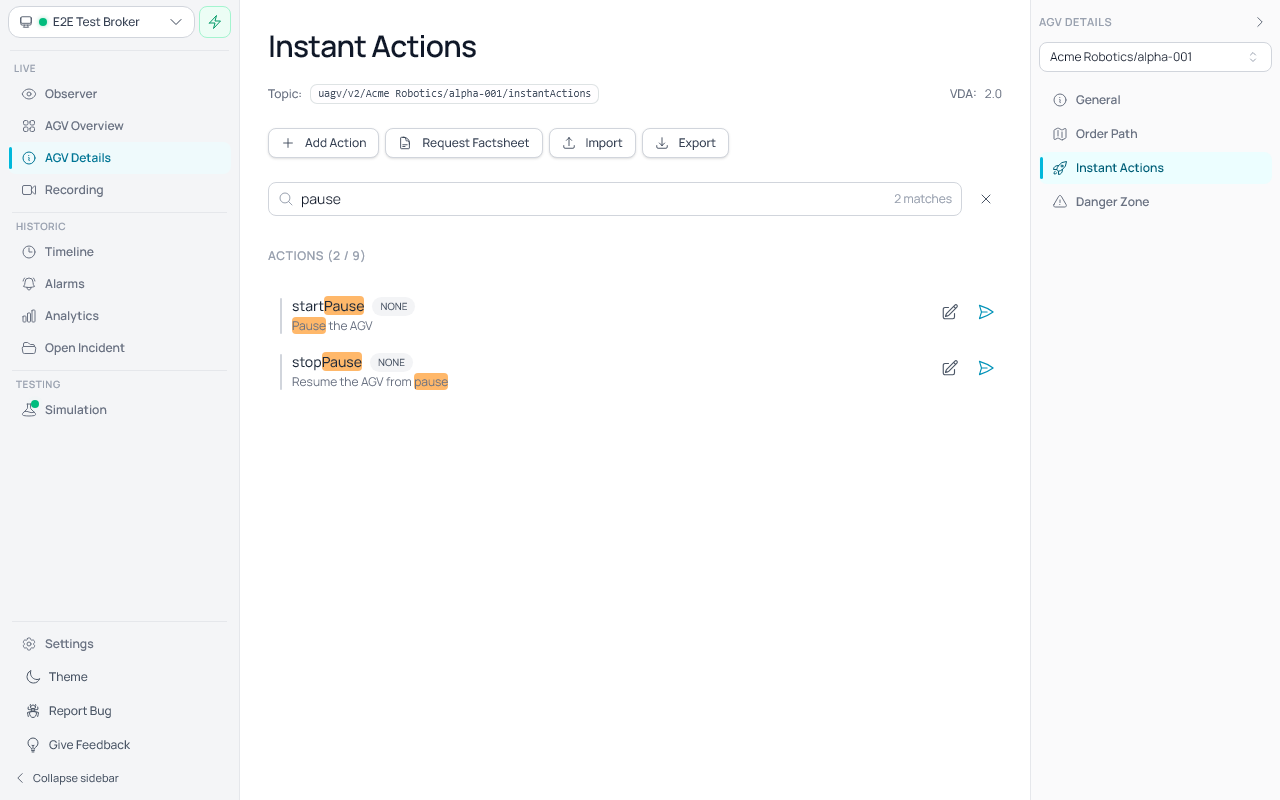
Search & Filter (Ctrl+F):
Press Ctrl+F to open the search bar. Type to filter actions by action name, parameter keys, or parameter values. The section header shows the filtered count (e.g. "Actions (2 / 9)"). Press Escape or click the close button to dismiss the search bar and restore the full list.
Request Factsheet (v2.0+):
For VDA 5050 v2.0 and newer, a Request Factsheet button is available. Click it to send a factsheet request instant action to the AGV. If the AGV responds with a factsheet message, any supported actions listed in the factsheet's protocolFeatures.agvActions are automatically added to your action list.
Adding Custom Actions:
Click Add Action to open a dialog where you can define a custom action with:
- Action type (e.g.,
pick,honk,customAction) - Blocking type (
NONE,SOFT,HARD) - Description
- Key-value parameters
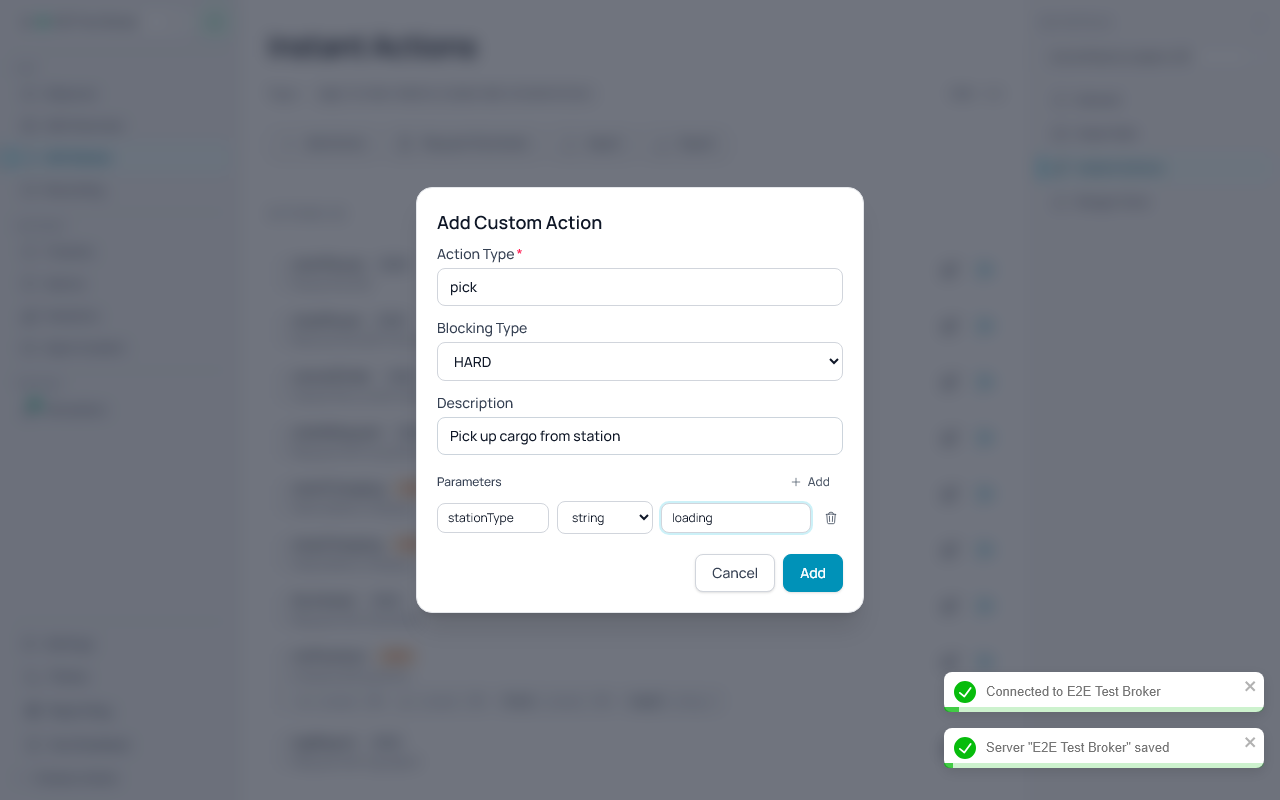
Custom actions appear in the list with a "custom" source badge.
Import & Export:
- Export: Exports all actions as a JSON file using the VDA 5050 action schema
- Import: Import actions from a JSON file with the format
{ "actions": [...] }
This allows sharing action configurations between users or backing up custom action sets.
Auto-Persistence:
Instant actions are automatically saved per AGV in a JSON config file on disk. The file is located at:
data/agv-config/{serverName}/{manufacturer}_{serialNumber}.json
When you reopen the Instant Actions page for the same AGV (on the same server), your previously configured actions are automatically restored. This also includes actions loaded from a factsheet or imported from JSON.
When fletr first detects the VDA version from an AGV's messages, the config file is automatically initialized with metadata (name, manufacturer, VDA version), default VDA 5050 actions for that version, and an empty routes array. If you have already customized the actions, they are preserved.
To reuse AGV configurations on another fletr instance, copy the data/agv-config/{serverName}/ directory to the target machine's data folder.
Search (Ctrl+F):
Press Ctrl+F to open the search bar. Type to filter actions by action name, description, parameter keys, or parameter values. Matching text is highlighted. Press Escape to close the search.
Danger Zone
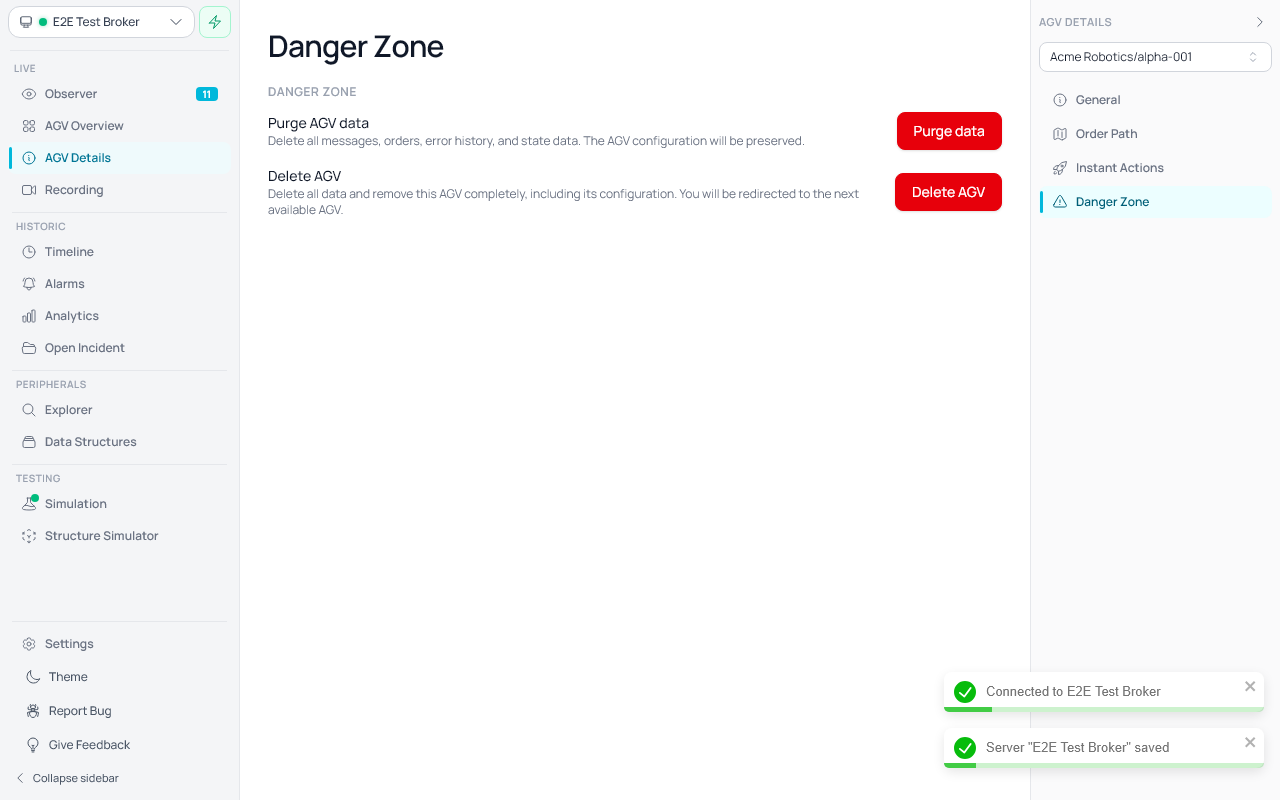
The Danger Zone page provides irreversible data management actions for the selected AGV. Access it from AGV Details → Danger Zone in the sidebar tool navigation.
Two actions are available:
- Purge AGV data — Permanently deletes all messages, orders, error history, state snapshots, and delta data for this AGV. The AGV's configuration (discovered or custom AGV record) is preserved, so the AGV will continue to appear in the sidebar and receive new data.
- Delete AGV — Permanently deletes all data and removes the AGV's identity record (discovered AGV entry or custom AGV configuration). After deletion, you are automatically redirected to the next available AGV. If no other AGVs exist, the empty state is shown.
Both actions require confirmation through a dialog before proceeding. The confirmation dialogs clearly describe what will be deleted and warn that the action cannot be undone.
Recording
The Recording page is the central hub for layout visualization and live AGV tracking. It lets you import VDA 5050 LIF files, capture AGV tracks in real time, overlay background images, and browse saved layouts — all on a Three.js canvas.
Access Recording from the left utility sidebar. The recording icon uses a video camera symbol.
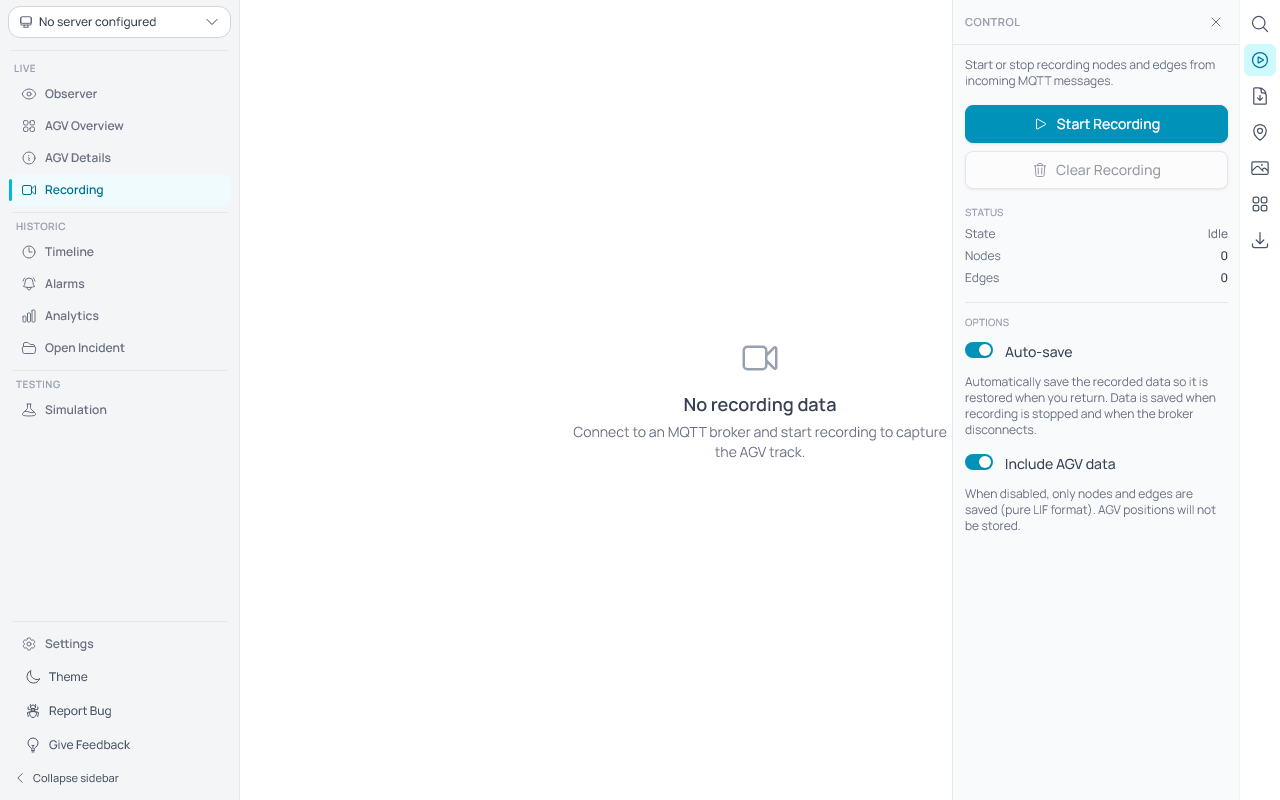
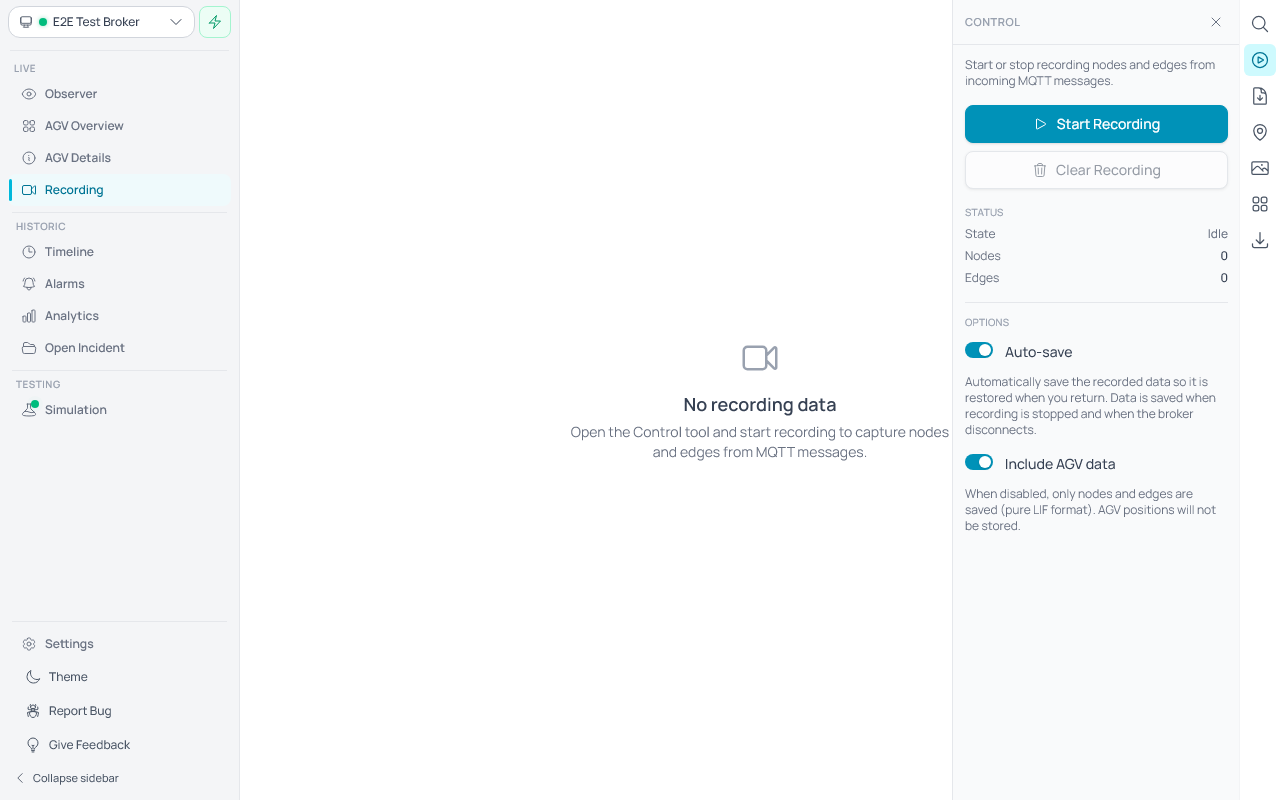
Starting a Recording
- Open the Control tool from the right-hand toolbar.
- Click Start Recording to begin capturing data.
- A green indicator shows the recording is active and listening for messages.
- Node and edge counts are displayed in the status panel as data arrives.
Importing a LIF File
Use the Import tool (document icon in the right-hand toolbar) to load an existing LIF file and seed the recording with pre-defined nodes and edges.
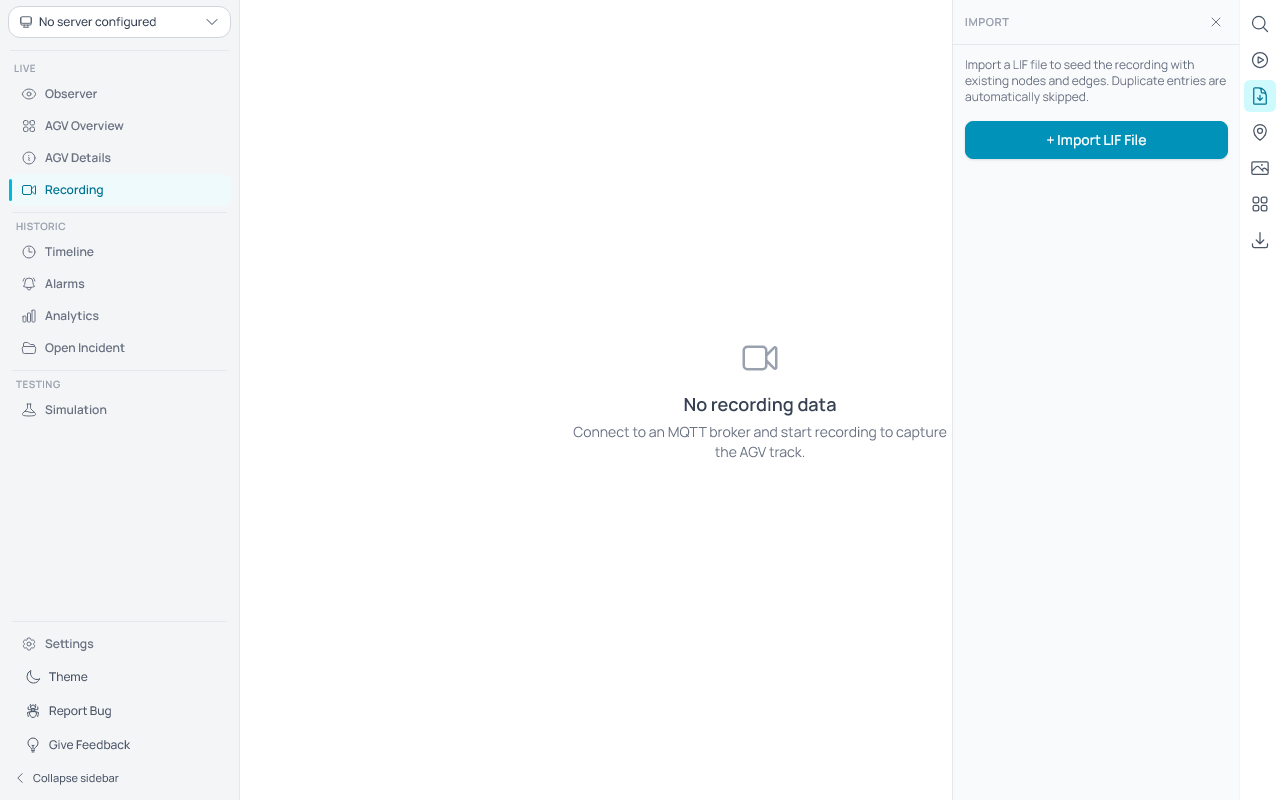
- Click the Import tool icon to open the import panel.
- Click + Import LIF File and select a
.jsonor.liffile from your file system. - The nodes and edges from the LIF file are merged into the current recording data.
You can import a LIF file before starting a recording to use its data as the initial seed, or during an active recording to add more reference data. Duplicate entries (matching node or edge IDs) are automatically skipped, so the same data is never stored twice.
The import panel lists all files imported in the current session with their node and edge counts. Use Clear Recording to remove all data (both imported and recorded).
Viewing the Track
While recording is active, nodes and edges appear on the Three.js canvas as they are received from order and state MQTT messages. Active AGVs are shown as colored rectangle markers at their current positions. Each marker smoothly slides between position updates instead of jumping, and a small triangle at the front indicates the travel direction. A tooltip next to each AGV shows its serial number and, when available, the current order ID. Offline AGVs appear in gray.
Use the Fit to View button (top-right) to zoom the canvas to fit all recorded data.
Stopping and Clearing
- Click Stop Recording to pause data capture. Existing recorded data remains on the canvas.
- Click Clear Recording to remove all captured nodes, edges, and AGV positions.
Layer Visibility
Open the Layers tool from the right-hand toolbar to toggle visibility of individual recording layers:
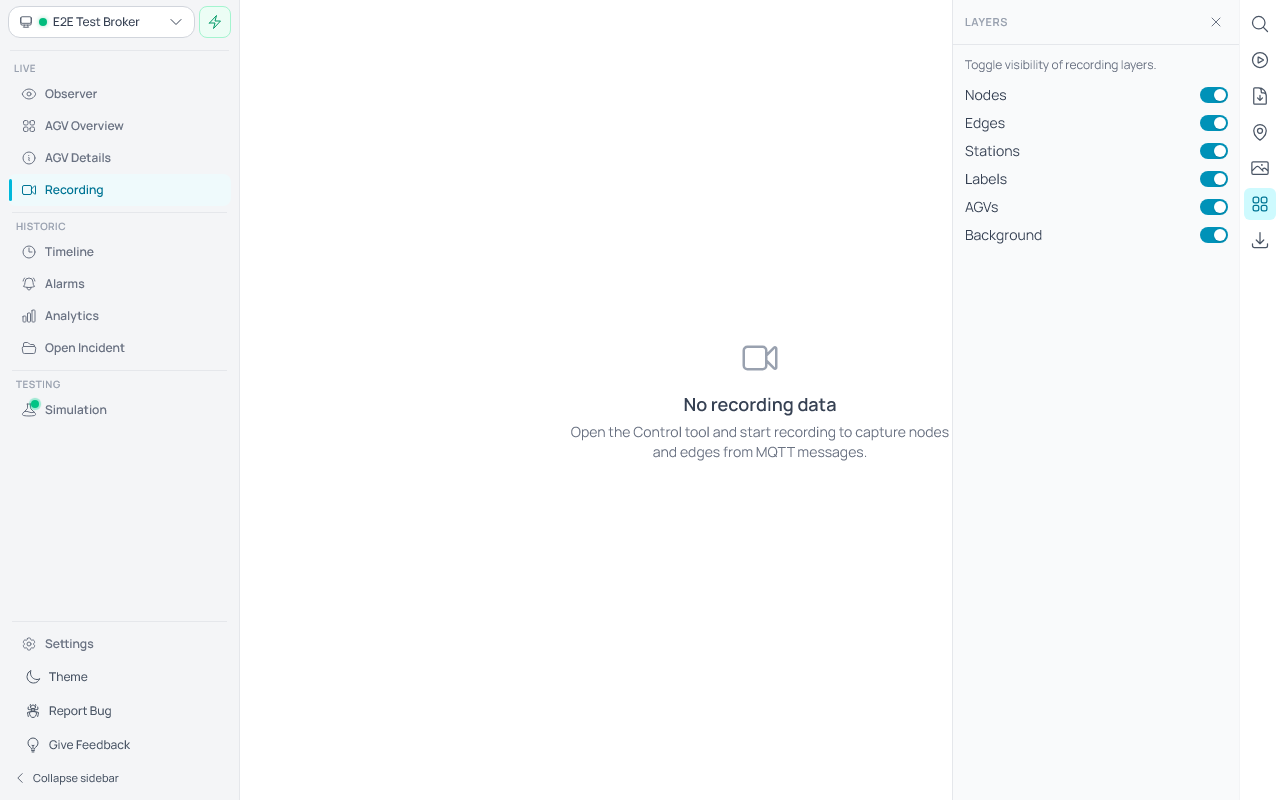
- Nodes — show or hide recorded waypoint circles.
- Edges — show or hide path lines between nodes.
- Stations — show or hide station markers (amber diamonds).
- Labels — show or hide node name text.
- AGVs — show or hide live AGV position markers.
- Background — show or hide uploaded background images.
Hiding layers you don't need improves rendering performance, especially with large recordings. All layers are visible by default.
Setting the Origin
Use the Origin tool (map pin icon in the right-hand toolbar) to adjust the coordinate origin of the recorded layout.
- Click the Origin tool icon to open the Origin panel.
- The panel shows the current layout offset (X, Y in meters).
- Click Set Origin Point to activate canvas click mode. A cyan indicator appears at the top-left of the canvas.
- Click anywhere on the canvas to select the reference point.
- A dialog appears — enter the real-world coordinates (in meters) for the clicked point.
- The layout shifts so the clicked point aligns with the entered coordinates.
- Click Reset Origin to return the offset to (0, 0).
The origin tool deactivates automatically when you switch to another tool.
Background Images
Use the Images tool (photo icon in the right-hand toolbar) to overlay background images on the recording canvas.
- Click the Images tool icon to open the Images panel.
- Click Import Images to upload one or more image files (PNG, JPEG, or SVG).
- Imported images appear in the list and on the canvas.
- Click an image in the list to select it. The selected image shows position/size controls and manipulation gizmos on the canvas.
- Use the Scale button to measure a known distance on the image: click two points, then enter the real-world distance.
- Use the Origin button to set the image origin: click a point, then enter its real-world coordinates.
- Toggle Lock Position to prevent accidental moves.
- Use the Layers tool to hide/show all background images at once.
Background images are persisted to the backend and survive page navigation.
Node, Edge, and Station Details
Click on any node, edge, or station on the recording canvas to open a detail panel on the right. The panel displays the available information for the selected item:
- Node Details — shows the node ID, name, position (X/Y coordinates), map ID, and any vehicle type properties or actions.
- Edge Details — shows the edge ID, start and end node names, and any vehicle type properties (speed, orientation, height limits) or actions.
- Station Details — shows the station ID, name, position, and any associated properties.
Click a different node, edge, or station to switch the detail view. Close the panel by clicking the X button or selecting a different tool from the toolbar.
Layout Elements
- Nodes (cyan circles): Navigation waypoints for vehicles.
- Edges (gray lines): Paths between nodes. When an edge includes a valid NURBS trajectory, the path follows the defined curve. Otherwise, nodes are connected by a straight line.
- Stations (amber diamonds): Locations where vehicles perform actions.
Searching for Objects
Use the Search tool ( magnifying glass icon, first in the right-hand toolbar) to quickly find nodes, edges, or AGVs by name or ID. You can also press Ctrl+F (or ⌘F on macOS) anywhere on the Recording page to open the search panel and focus the input.
- Type a search query to filter objects in real time.
- Nodes are matched by node ID and node name.
- Edges are matched by edge ID, start node ID, or end node ID.
- AGVs are matched by serial number or manufacturer.
- Each result shows a small icon representing its type: a cyan circle for nodes, a gray arrow for edges, and a colored rectangle for AGVs.
- Click any result to open its detail panel.
- Press Escape to close the search panel.
AGV Details on the Recording Canvas
Click on any AGV marker on the recording canvas to select it and open an inline detail panel. The selected AGV is highlighted with a cyan outline on the canvas.
The panel displays:
- Info — manufacturer and serial number, connection status (online/offline).
- Position — current X, Y coordinates and orientation angle (θ).
- Status — operating mode, driving state, battery level with a color-coded bar (green/yellow/red), and the current order ID.
- Planned Path — a collapsible section showing the AGV's current order path as a vertical timeline, with completed, active, and remaining nodes/edges. Click the section header to collapse or expand it.
Click a different AGV to switch to its details. Clicking the same AGV again deselects it. Selecting a node or edge also clears the AGV selection and vice versa.
Saving a Recording
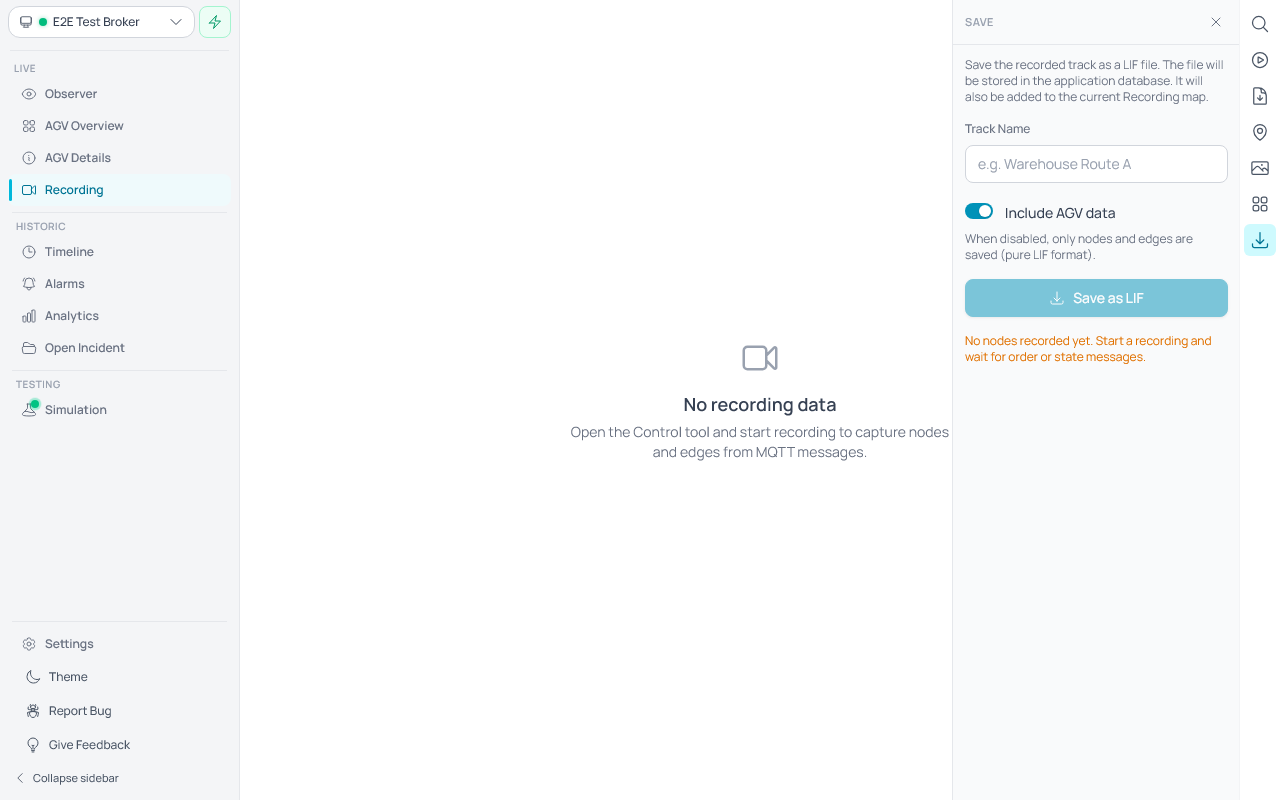
- Open the Save tool from the right-hand toolbar.
- Enter a name for the track (e.g. "Warehouse Route A").
- Toggle Include AGV data on or off. When on, AGV positions are stored alongside the nodes and edges. When off, only the nodes and edges are saved (pure LIF format).
- Click Save as LIF to store the recorded track as a LIF file.
- The saved file is stored in the application database and is also added to the current recording layout, keeping it co-located with any background images you added.
Note: Saving is disabled while recording is active. Stop the recording first, then save.
Auto-save
Recording data is automatically saved in the background so it can be restored when you return to the Recording page. This feature is enabled by default.
- Auto-save — when enabled, recorded nodes, edges, and (optionally) AGV positions are persisted automatically every time the data changes. The data is loaded when the Recording page is opened.
- Include AGV data — when enabled, AGV positions are included in both the auto-save and manual saves. When disabled, only nodes and edges are saved, producing a pure LIF-compatible file.
Both options are configurable in the Control tool panel.
Preview Features
The features below are preview features — fully functional but still being polished. Enable each one in Settings → Feature Preview. Behavior may change between releases.
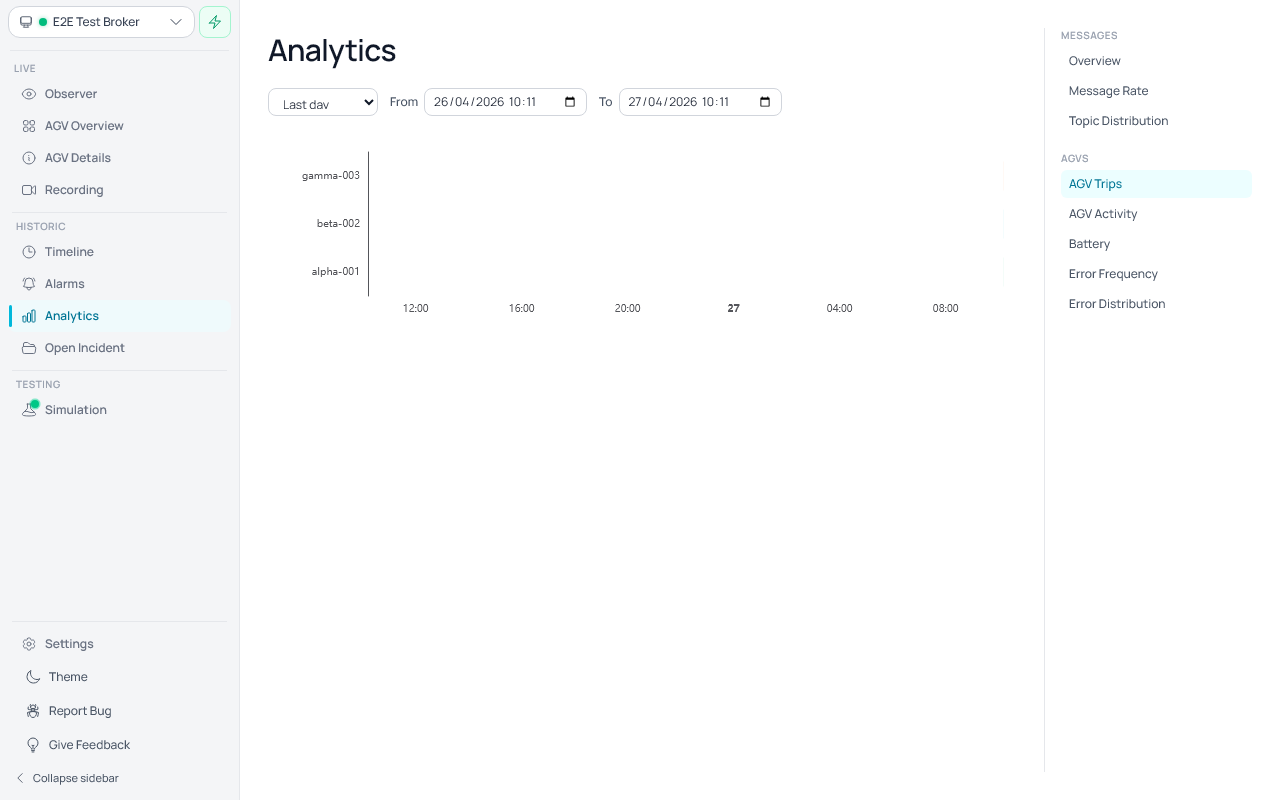
Analytics
Toggle: Analytics
The Analytics page provides interactive charts for analyzing AGV fleet performance over a selected time range. Access it from the left utility sidebar under the Historic section.
A date range filter at the top lets you select the time window. The right sidebar provides navigation between chart sections.
Messages
- Overview — Combined view showing message rate and topic distribution with a total message count.
- Message Rate — Line chart showing message throughput over time, bucketed across the selected range.
- Topic Distribution — Donut chart showing the proportion of messages by VDA 5050 topic type (state, order, visualization, etc.).
AGVs
- AGV Trips — Gantt chart displaying order execution timelines per AGV. Each horizontal bar represents one order, spanning from start to completion. Ongoing orders extend to the end of the selected range. Hover over a bar to see the order ID, start/end time, and duration.
- AGV Activity — Bar chart showing the percentage of time each AGV spent driving per time bucket.
- Battery — Line chart tracking average battery charge per AGV over time.
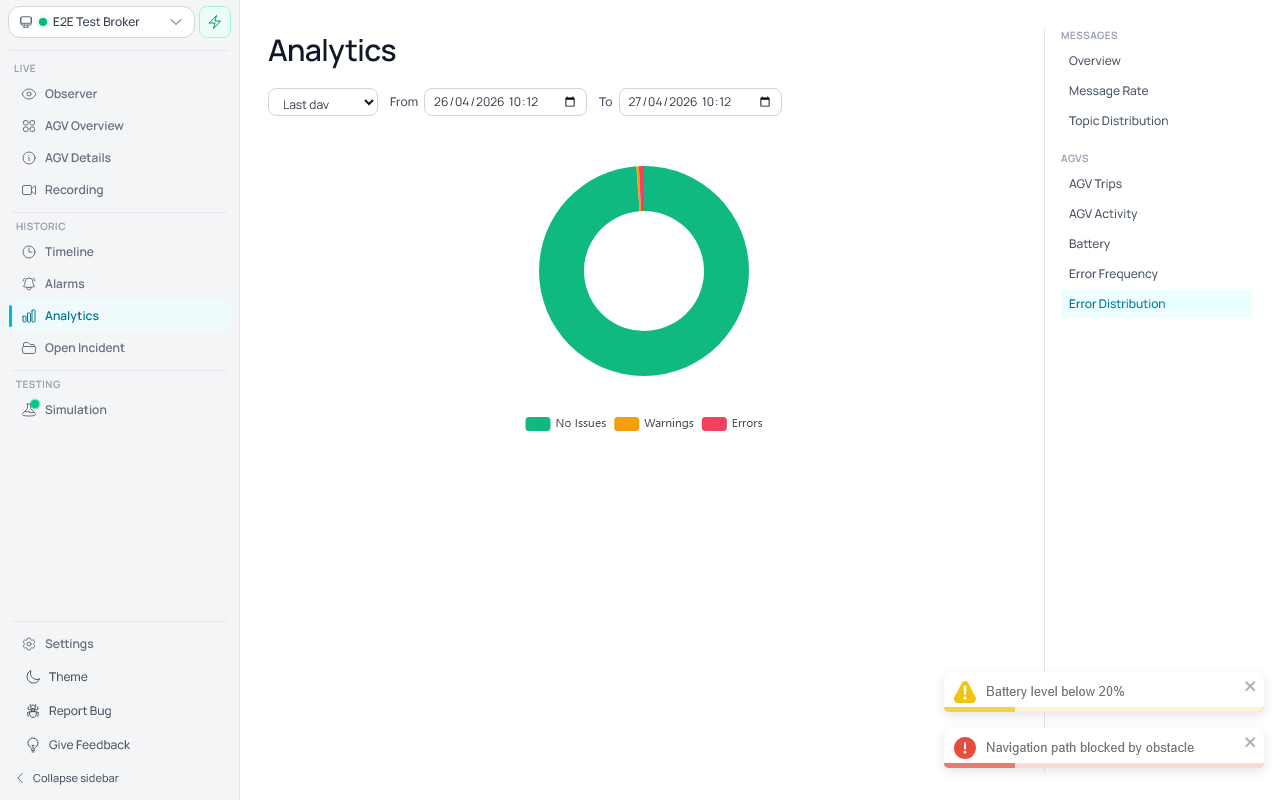
- Error Frequency — Stacked bar chart showing the count of errors and warnings per time bucket.
- Error Distribution — Donut chart showing the overall proportion of time spent with errors, warnings, or no issues across the selected range.
Explorer
Toggle: Peripherals
The Explorer page lets you discover what topics a connected MQTT broker is currently publishing on, without storing any payloads.
When the Peripherals preview is enabled, a Peripherals section appears in the left utility sidebar between Historic and Testing with a single Explorer entry.
Starting and stopping discovery
- Connect to an MQTT broker, then open Explorer. Discovery starts automatically as soon as the page opens — it subscribes to the wildcard topic
#and stops again when you navigate away. The backend tracks each topic's message count, last-seen timestamp, and last payload size in memory only — payloads are never written to disk. - New topics appear in the tree within ~250 ms; existing topics update their counts in place.
- Click Reset at any time to clear the accumulated tree (both the on-screen view and the backend's session state) without leaving the page.
Reading the tree
- Topics are split on
/and rendered as a collapsible tree. - Leaf nodes show: messages received during the session, last payload size, and last-seen time.
- Click a chevron to expand or collapse a branch.
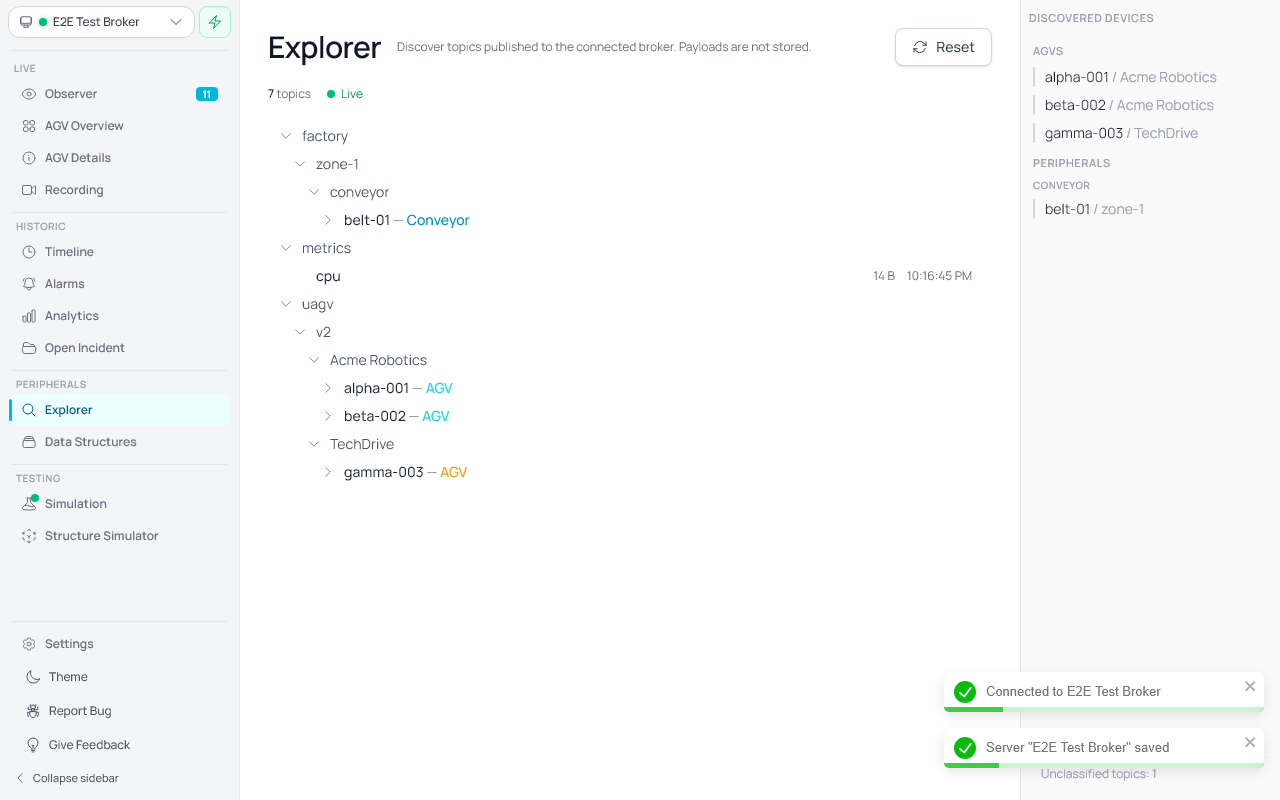
Discovered Devices sidebar
The right-hand Discovered Devices panel classifies incoming topics into two sections:
- AGVs — every topic that matches the configured auto-discovery template or one of the well-known VDA 5050 roots (
vda5050/v{version}/{manufacturer}/{serialNumber}for v3.0+,uagv/v{version}/{manufacturer}/{serialNumber}for v1.x / v2.x) is grouped under itsmanufacturer/serialNumberidentity. Each AGV row in the sidebar shows the agvId in plain text; the matching root node in the topic tree carries a colored "— AGV" type label. - Peripherals — every topic that matches a Data Structure's auto-discovery path is grouped under that structure. The section uses one uppercase-tracked subheading per matching Data Structure (e.g.
Conveyor,Sensor); rows underneath share the same flat row style as AGV rows. Topics from two different placeholder values (e.g.belt-01andbelt-02) become two rows under the same subheading; multiple topics for the same device (e.g.stateandcommand) collapse into a single row. AGV matches always win over peripheral matches when a topic could be claimed by both.
When at least one AGV or some unclassified traffic exists but no Data Structure has matched yet, an inline hint reading "Define Data Structures to classify peripherals." appears in place of the Peripherals list — the highlighted phrase links straight to the Data Structures page.
Topics that match neither an AGV template nor any Data Structure are no longer rendered as individual rows. Instead an Unclassified topics: N counter appears at the bottom of the sidebar so you can see at a glance how much traffic is flowing outside your configured types; the topic tree on the left continues to show those topics in full.
The sidebar updates live as new topics arrive and clears in lock-step with the tree on Reset or broker disconnect.
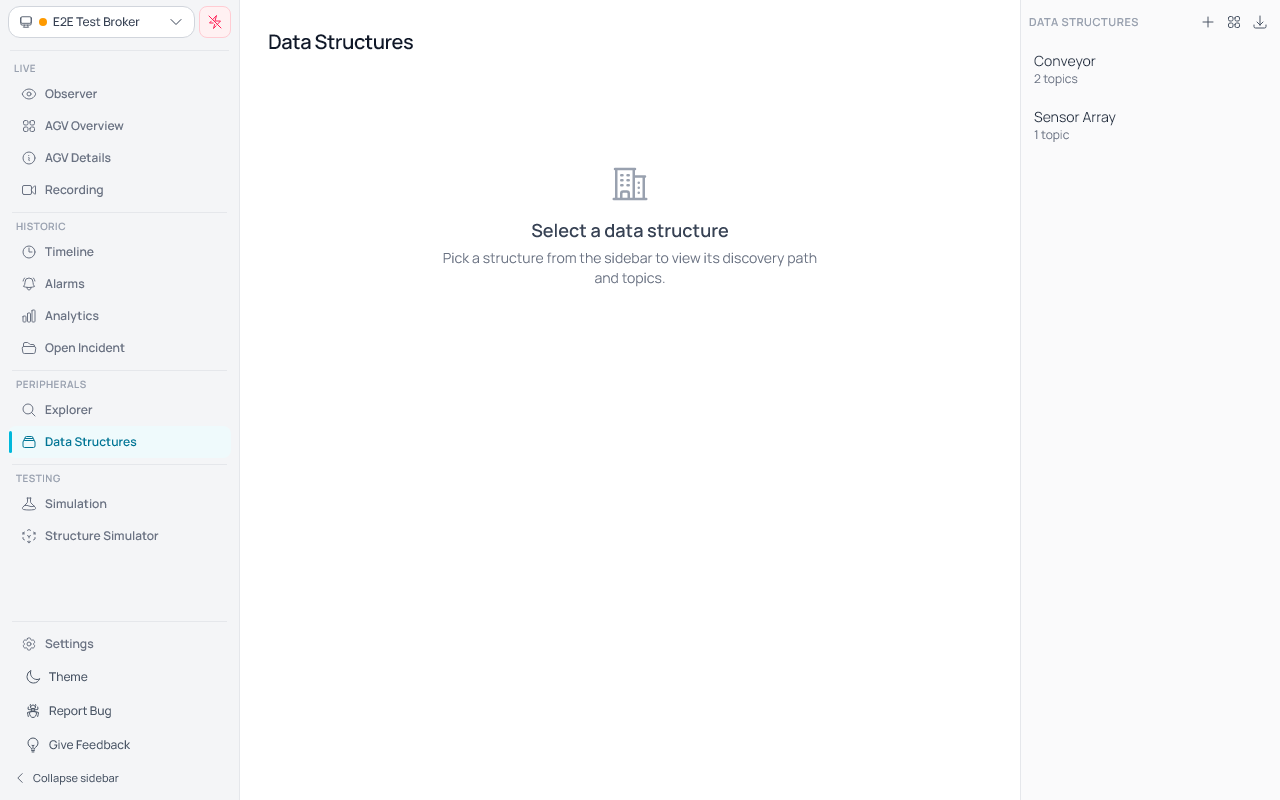
Data Structures
Toggle: Peripherals
The Data Structures page lets you describe the families of MQTT topics the peripheral devices on your broker publish on. A data structure consists of:
- a name (e.g.
Conveyor), - an auto-discovery path with named placeholders such as
factory/{zone}/conveyor/{deviceId}— captured names will later be available as variables for prepared actions, - a list of topics that live underneath the structure (e.g.
state,command).
Adding, editing, and deleting
- Use the + button in the top-right of the right-hand sidebar to open the editor dialog. Fill in the name, discovery path, and at least one topic, then click Create.
- The grid icon next to + opens the Browse templates catalog (see below) for one-click adds of standard archetypes.
- Each row in the sidebar selects the structure on click. The detail pane on the left shows the discovery path and topic list; the Edit button in the detail header reopens the dialog.
- The Delete button (trash icon) in the detail header removes the structure after a confirmation prompt.
- The detail header is sticky — the structure name, ID, and Edit / Delete buttons stay visible while scrolling through long topic lists. A clipboard icon next to the ID copies it to the clipboard.
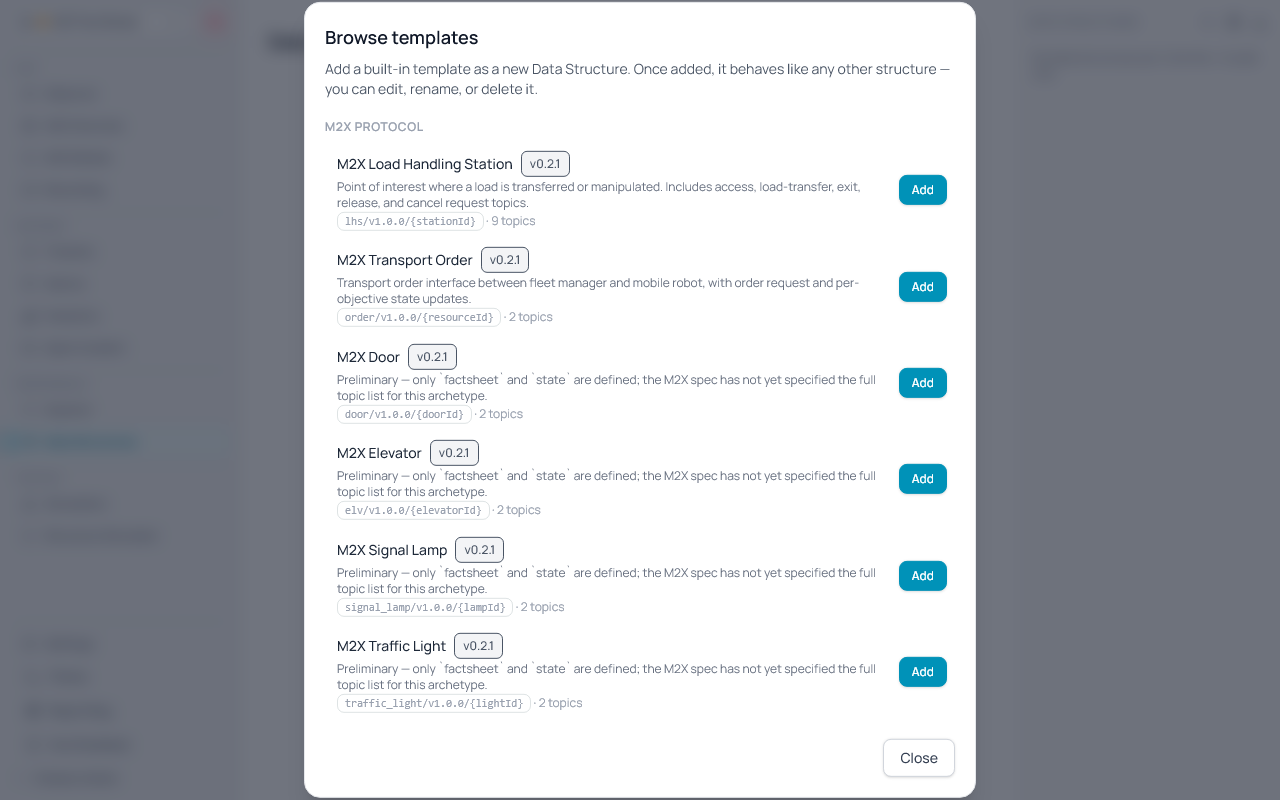
Browse templates (M2X catalog)
Fletr ships a built-in catalog of M2X protocol archetypes so you don't have to define common peripheral families from scratch.
- Click the grid icon in the sidebar header to open the Browse templates dialog. The catalog lists every entry under M2X Protocol with its discovery path and topic count.
- Click Add on an entry — Fletr creates a regular Data Structure with the catalog's discovery path, topic list, and prepared messages. The dialog stays open so you can add several entries in a row; entries already added show an Already added pill instead of Add.
- Once added, M2X templates behave like any other Data Structure — you can rename, edit the discovery path, add topics, or delete them.
- Two M2X archetypes are spec-complete and ship with full topic lists and prepared messages: Load Handling Station (LHS) and Transport Order.
- Four archetypes are named in the M2X spec but their topic structure isn't finalised yet: Door, Elevator, Signal Lamp, Traffic Light. They ship with the universal
factsheetandstatetopics only and are flagged as preliminary; the topic list will expand in a future Fletr release as the M2X spec firms up.
Reading a structure
- The Auto-discovery path section shows the configured template; when the path uses
{placeholders}, a "Matches paths like …" preview is rendered underneath with sample values substituted in (e.g.factory/zone-1/conveyor/belt-01). - The Topics (N) section header includes the topic count. Each topic is a collapsible row; the row label appends
(M)when the topic has prepared messages attached, and reveals a copy-topic-path icon on hover so the resolved topic path can be pasted into broker tools. - Expanding a topic reveals its Prepared messages (M) subsection. Each prepared message expands to show its formatted JSON payload, with a copy-payload button at the top-right of the payload box.
Compact this topic
Each topic in a Data Structure has a Compact this topic switch (default on). When on, messages on the topic are stored as a periodic snapshot every 30 s plus a small delta row for each changed field — saving substantial disk space for chatty peripherals that re-send mostly identical payloads.
Turn the switch off when you need every raw message preserved verbatim — for example, a regulatory audit topic, or while you're investigating a bug and want to inspect each message individually. With compaction off, the topic uses the same one-row-per-message storage as ungated MQTT traffic.
Switching the toggle takes effect immediately for new messages; messages already stored under the previous setting are unaffected.
Import / export
- Click the download icon in the sidebar header to export every structure as a single JSON file (schemaVersion 1). Each export is a clean snapshot — the file is named
data-structures-YYYYMMDD-HHmm.jsonbased on local time. - Click the upload icon to import a previously-exported file. Structures whose
idalready exists are skipped; the rest are added. A toast at the bottom-right of the screen reports the imported / skipped counts.
Actions — prepared MQTT statements targeted at one of the structure's topics — are reserved for the next iteration. The detail pane shows a placeholder card where the action editor will live.
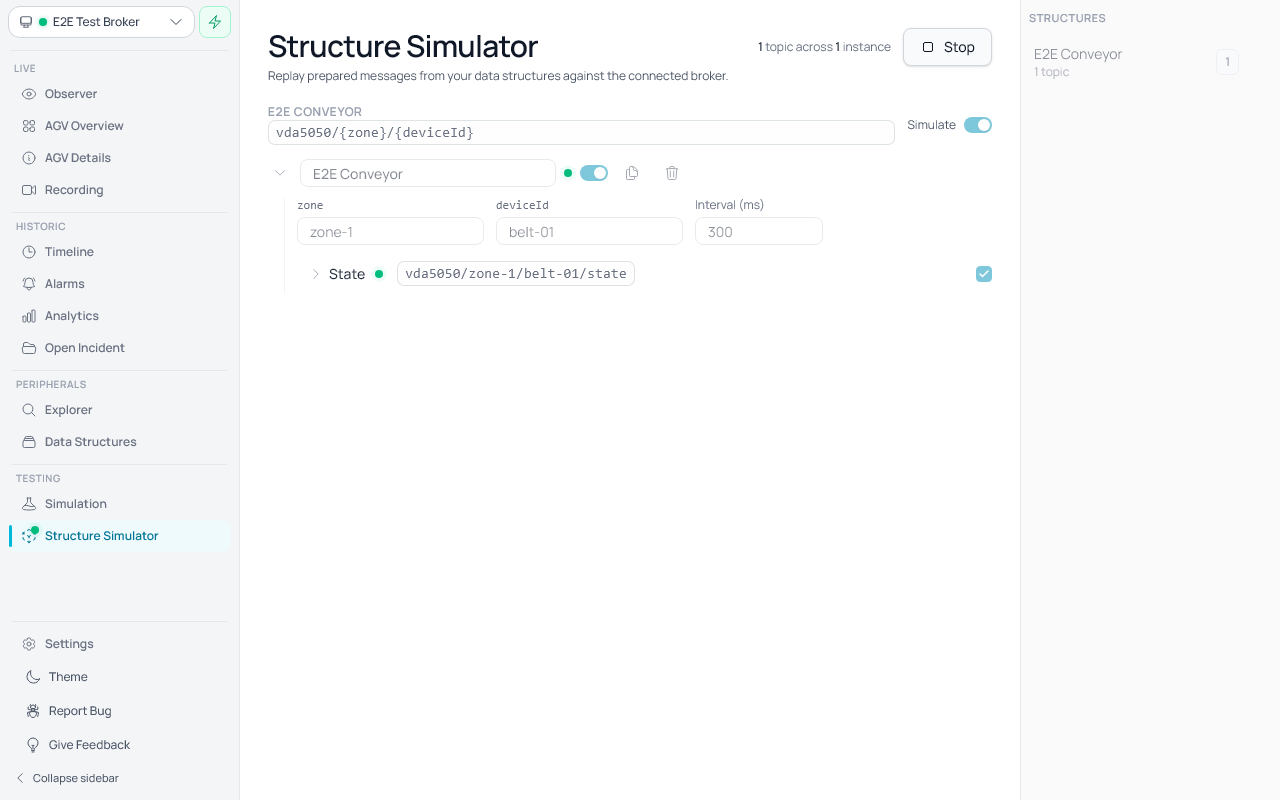
Simulating a data structure
The Structure Simulator (Testing → Simulation → Structure Simulator) replays a Data Structure's prepared messages against the connected broker. Useful for end-to-end demos and for testing dashboards without wiring up real hardware. The Structure Simulator is part of the Peripherals preview and only appears when that toggle is on.
- Open Structure Simulator. The right-hand Structures sidebar lists every Data Structure in your library with its topic count and (once you've added any) a badge showing how many instances of that structure are currently configured.
- Click a structure in the sidebar to add an instance. The first click creates an instance with default placeholder values (e.g.
zone-1,belt-01) and flips the structure's Simulate toggle on. Click the same row again to add a second instance, a third, and so on. - The main viewport groups instances by structure. Each group has a per-structure Simulate toggle that activates or deactivates every instance underneath it at once.
- Override placeholder values per instance and change the per-instance interval (default 300 ms).
- Inside an instance, toggle individual topics on/off and individual prepared messages on/off. The simulator round-robins through the active prepared messages on every tick.
- The instance name is an inline text field — type to rename it. To the right of the activate switch you'll find a Duplicate icon (copies the instance with its placeholder values) and a Delete icon (asks for confirmation before removing the instance).
- Click Start to begin publishing. While running, every control is disabled — Stop first if you need to edit. Navigating away from the page or disconnecting the broker also stops the simulation.
Configuration (instances, toggles, placeholder values) survives navigation but not app restart — by design, since the simulator is an in-session test bench.
Peripherals tab in the Devices sidebar
Toggle: Peripherals
Once you've defined a Data Structure (e.g. Conveyor with discovery path factory/{zone}/conveyor/{deviceId}), Fletr automatically discovers any device whose topic matches that pattern and lists it in the right-hand devices sidebar under Peripherals. The sidebar is shared across Observer, Timeline, and Simulation.
The sidebar shows one panel at a time — AGVs or Peripherals. Switch between them with the vertical icon menu pinned to the right edge of the window. AGVs is selected by default; the title above the list reflects the active panel. Click the × button in the sidebar header — or click the active icon in the menu a second time — to close the sidebar entirely; the menu stays visible so you can reopen either panel with one click. The Dashboard (AGV Overview) page intentionally hides the menu and locks the sidebar to AGVs so the at-a-glance fleet status stays AGV-only.
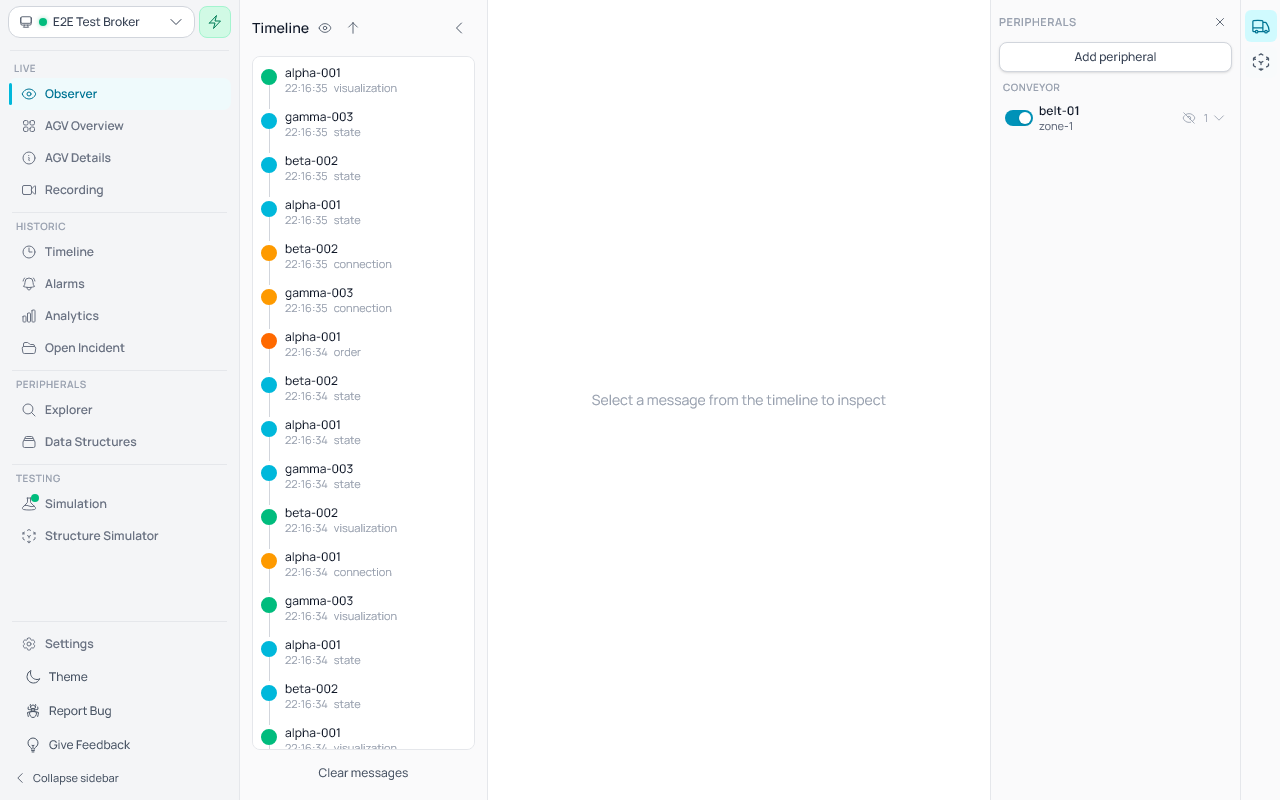
- Discovery is always on. As soon as a Data Structure with a non-empty discovery path exists, Fletr starts watching for any matching peripheral — no need to keep the Explorer page open.
- Click a peripheral row to expand it and see its topics with the prepared messages you defined for that structure. Clicking Send on a message opens a dialog showing the resolved topic (e.g.
factory/zone-1/conveyor/belt-01/state) and the payload, which you can tweak before publishing. Send is single-shot; for recurring traffic use the Structure Simulator instead. - To add a peripheral that isn't currently publishing, click Add peripheral at the top of the section, choose a Data Structure, and fill in the placeholder values. The dialog previews the resolved discovery prefix as you type and rejects placeholder values that contain
/or duplicate an existing peripheral. - Hide a peripheral by clicking the eye-slash icon — it disappears from the sidebar and its messages stop appearing in Observer and Timeline. A Show hidden (N) footer at the bottom of the section restores everything in one click.
- Toggle visibility with the switch on each row to filter that peripheral's messages out of Observer and Timeline without removing the row from the sidebar.
- Custom-added rows carry a small X button next to the dismiss icon — click it to delete the row outright. If matching MQTT traffic arrives later, a fresh discovered row will be created automatically.
- When a Data Structure is deleted, every peripheral that matched it is removed in cascade. Historical messages stay until the message-retention sweep runs.
- When a Data Structure's discovery path changes shape, peripherals that no longer fit the new placeholder set are marked orphaned and hidden from the sidebar; they're hard-deleted after 24 h in case you reverted the change in the meantime.
Settings
The Settings page is accessible from the gear icon in the left utility sidebar, positioned above the collapse button.
The settings page is organized into categories with a right-hand sidebar for navigating between settings sections.
Server Settings
Database Settings
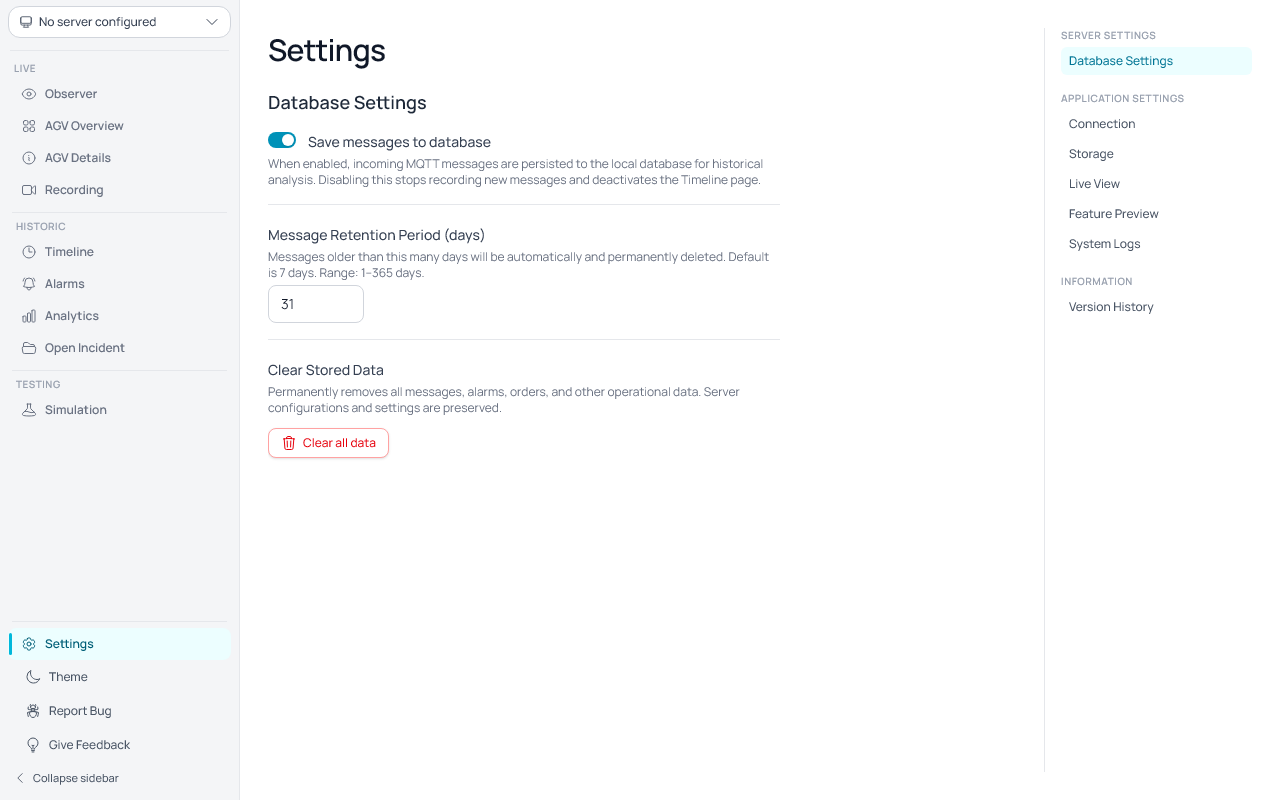
Controls whether incoming MQTT messages are saved to the local database and how long they are retained.
Save messages to database
- Default: Enabled (messages are saved)
- When disabled, new incoming messages are no longer written to the database. Live features (Observer, Dashboard, Simulation) continue to work normally.
- The Timeline page is greyed out in the sidebar and cannot be opened while persistence is disabled.
- Existing historical data is not cleared when disabling persistence — it remains saved.
- Re-enabling persistence resumes saving new messages immediately (no reconnect required).
Message Retention Period
- Default: 31 days
- Range: 1–365 days
- Messages older than the configured number of days are permanently deleted (no recovery). The cleanup runs every hour.
- Retention respects per-server settings — see Storage below.
- Only available when Save messages to database is enabled.
Clear Stored Data
- Permanently removes all messages, alarms, orders, and other operational data from the database.
- Server configurations, custom AGVs, LIF files, maps, and application settings are preserved.
- A confirmation dialog is shown before clearing to prevent accidental data loss.
- While clearing, a spinner and status text are displayed on the button.
- After clearing, the database is compacted to reclaim disk space.
Application Settings
Connection
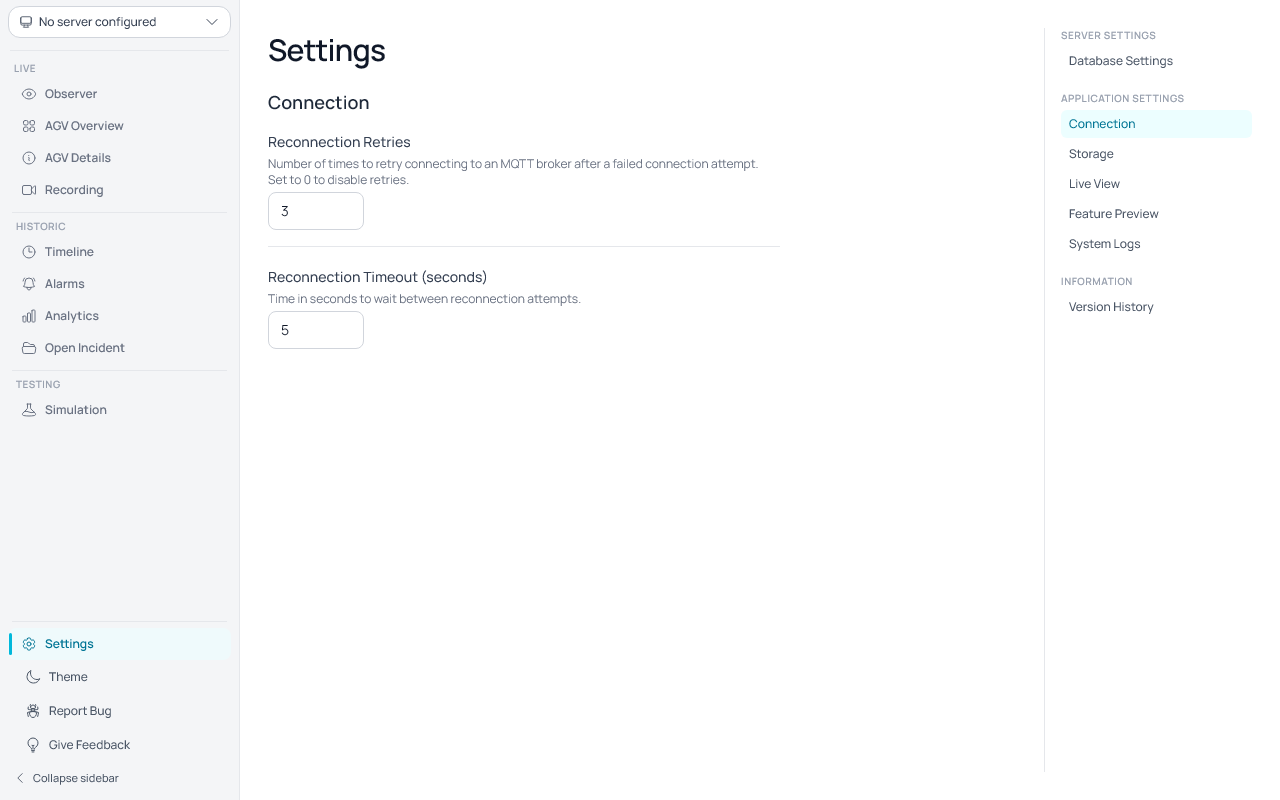
Controls connection behavior for MQTT brokers.
Reconnection Retries
- Default: 3 retries
- Range: 0–10
- Setting 0: Disables automatic retries; the app gives up after the first failure.
Reconnection Timeout
- Default: 5 seconds
- Range: 1–60 seconds
- The connection status updates in real time to show the current retry attempt.
Storage
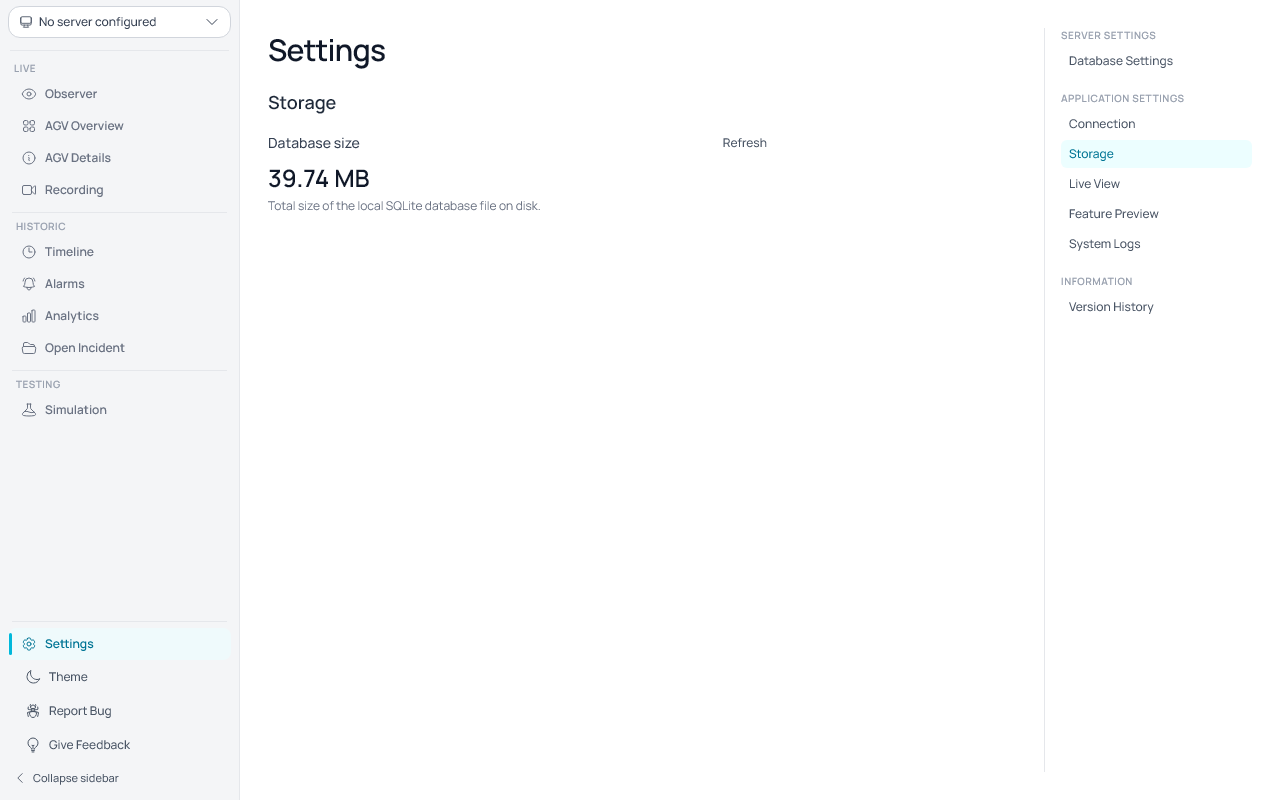
General database management settings.
Database Size
- Displays the current size of your local data store.
- Click Refresh to update the displayed size.
- The size is shown in bytes (B), kilobytes (KB), or megabytes (MB) depending on the current size.
Per-Server Message Retention
- Each configured MQTT server can individually opt out of automatic message deletion.
- When a server's retention toggle is enabled (default), its messages are subject to the global retention period.
- When a server's retention toggle is disabled, messages from that server are never automatically deleted.
- Toggles are greyed out when Save messages to database is disabled.
- Per-server retention settings are saved with each server's configuration.
Feature Preview
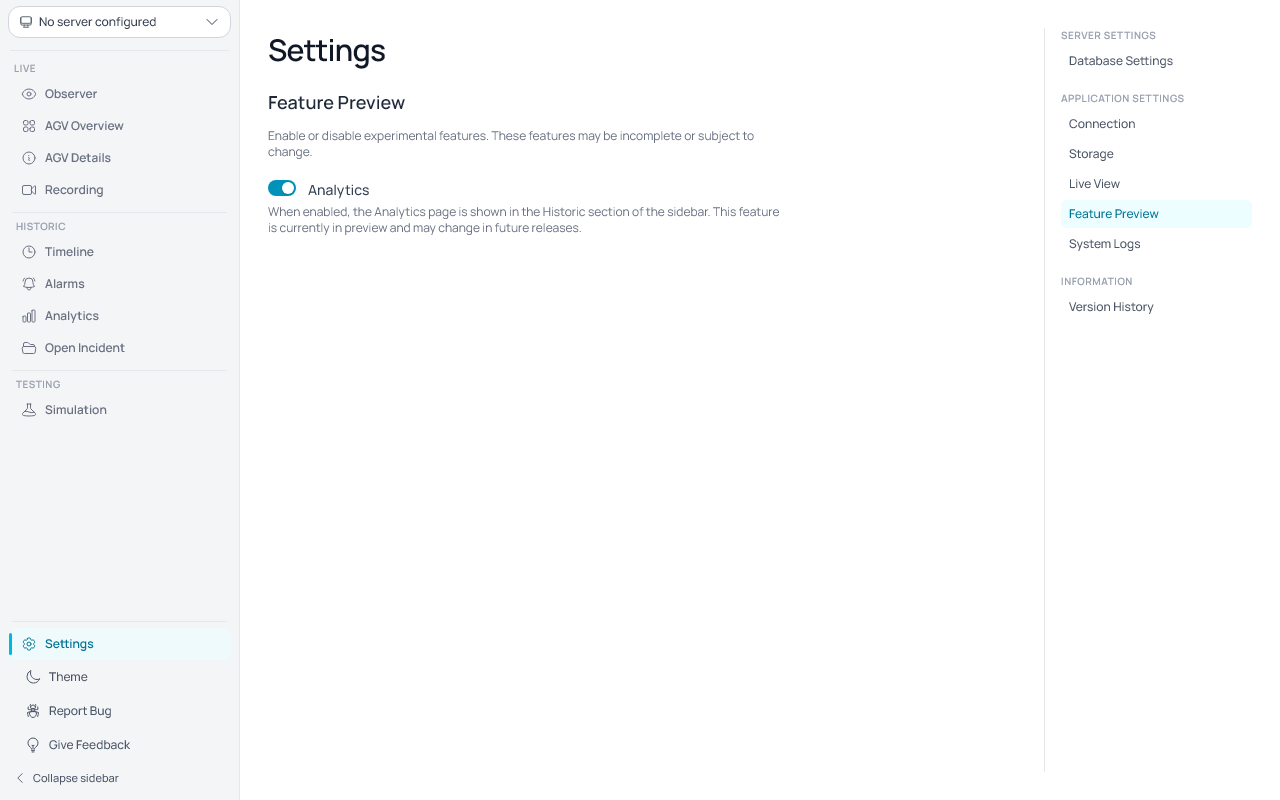
Enable or disable experimental features. These features may be incomplete or subject to change. See the Preview Features section for full descriptions of what each toggle unlocks.
Analytics
- Default: Disabled
- When enabled, the Analytics page is shown in the Historic section of the sidebar.
- This feature is currently in preview and may change in future releases.
Peripherals
- Default: Disabled
- When enabled, the Peripherals section with the Explorer page is shown in the sidebar.
- This feature is currently in preview and may change in future releases.
Live View
Show All AGVs on Dashboard
- Default: Disabled
- When enabled, the AGV Overview dashboard is pre-populated with all saved/discovered AGVs and their last known status, even without receiving new messages. The dashboard list matches the AGV sidebar list.
- When disabled, the dashboard only shows AGVs that have sent messages in the current session.
- In both modes, hidden AGVs (unchecked in sidebar or hidden via the dashboard eye-slash button) are not shown.
- Hidden AGVs automatically reappear everywhere when new messages are received for them.
System Logs
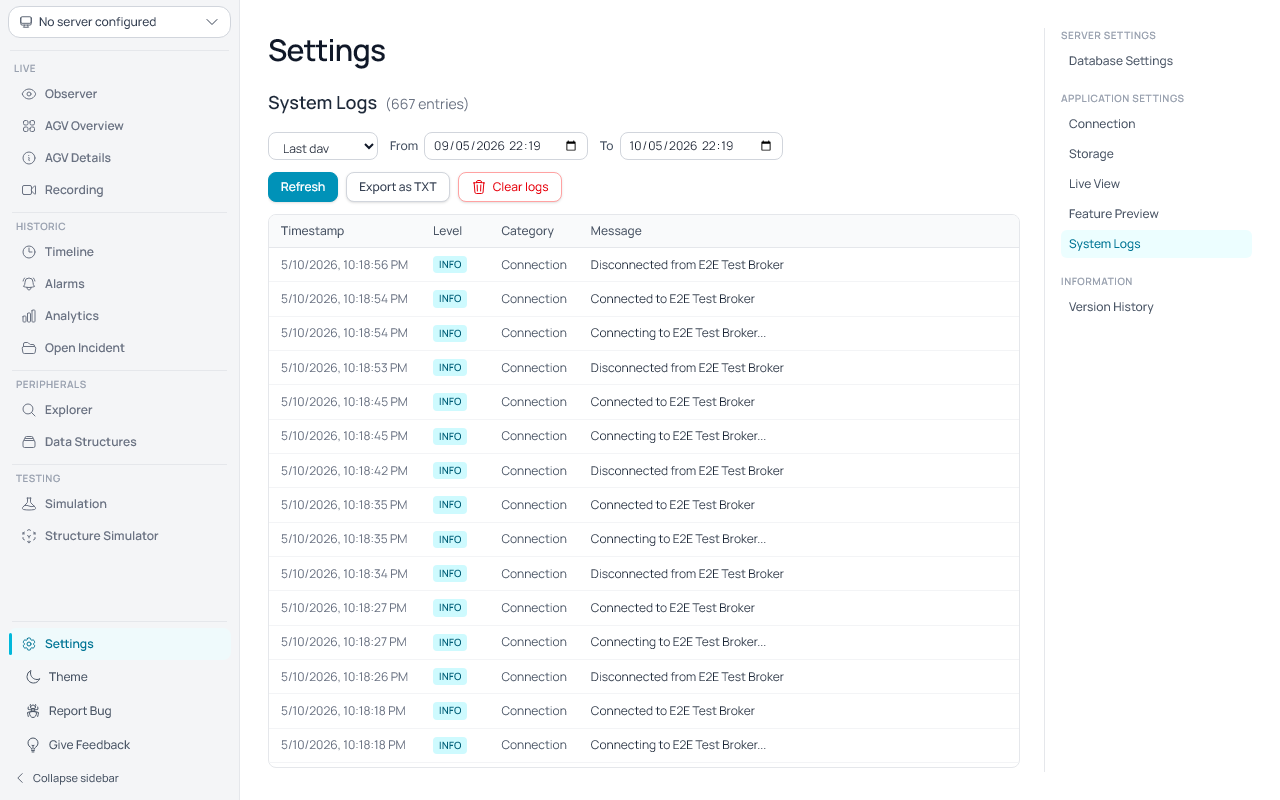
The System Logs panel shows a persistent log of key application events, particularly around MQTT broker connectivity.
- Time range filter: Use the From and To date/time pickers to limit the displayed entries. The default view shows the last 1 day.
- Refresh: Click Refresh to reload entries for the current time range.
- Log levels are colour-coded:
- INFO (cyan) — successful connections, voluntary disconnects.
- WARN (amber) — connection losses, retry attempts.
- ERROR (red) — failed connection attempts.
- Categories:
- Connection — MQTT broker connection events (attempts, retries, disconnects, errors).
- AGV — AGV-related events.
- System — general system events.
- Export: Click Export as TXT to open a prompt where you can adjust the time range and then download a plain-text file containing all matching log entries, one per line in the format
[timestamp] [LEVEL] [Category] Message.
Log entries are subject to the same retention period as MQTT messages (configurable under Database Settings). Entries older than the retention period are automatically deleted.
Information
Version History
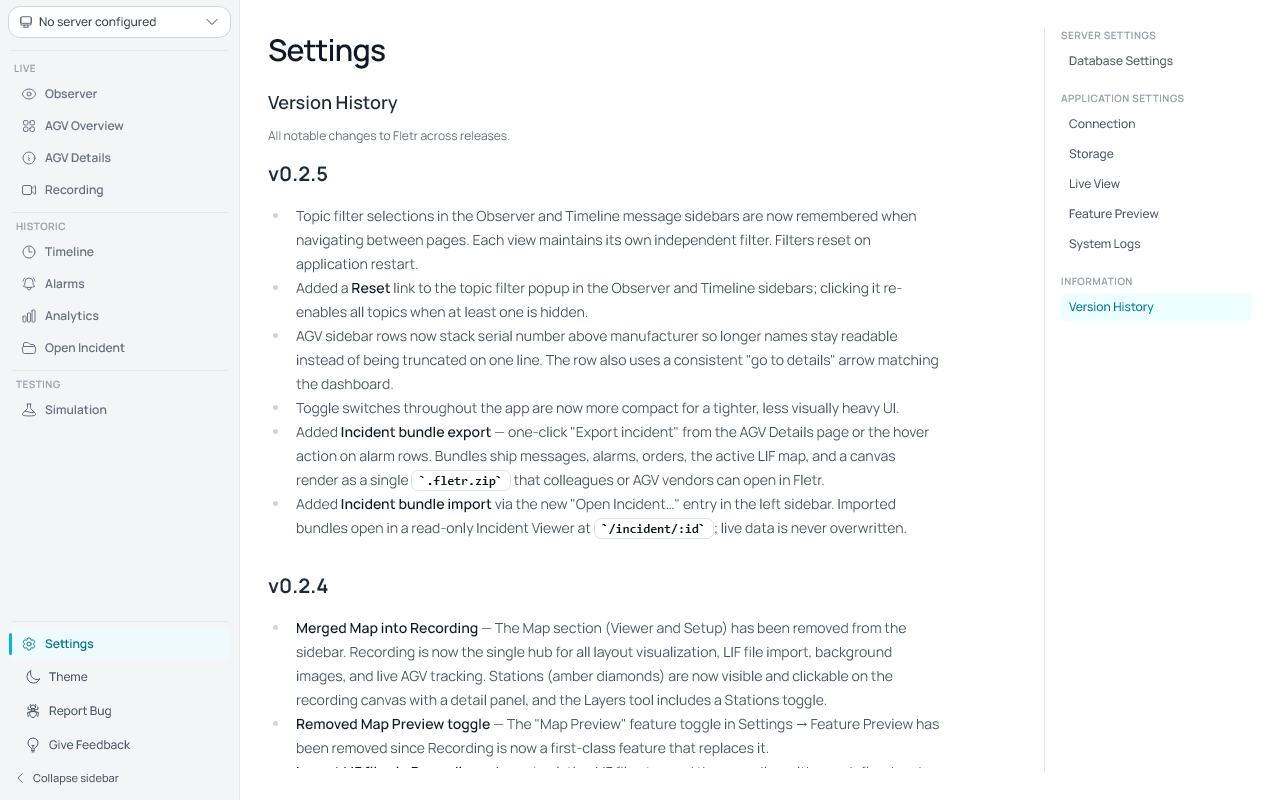
Displays the complete changelog of the application directly inside the app. Each release is listed with its version number and a summary of changes.
- Browse all past release notes without leaving Fletr.
- Entries are organized by version, with the newest releases listed first.
- Content is automatically updated with each new release.
Global settings and per-server settings are saved automatically and persist across restarts.
8. Incident bundles
Incident bundles are self-contained .fletr.zip archives of what happened to one AGV over a short time window. Support engineers use them to ship diagnostic context to AGV vendors without screenshots and copy-pasting; anyone with a copy of Fletr can open the bundle and review it exactly as it looked on the original machine.
A bundle contains:
- VDA 5050 snapshots and change-only deltas for the AGV during the window
- All alarms that overlap the window (FATAL and WARNING error intervals)
- Stitched order paths active during the window
- The currently active LIF map and its background images
- A PNG render of the map with the AGV marked — captured at export time so the render is consistent regardless of which page the export was triggered from
- A
manifest.jsonthat stamps the exporter's app version, the server name, the AGV identity, the window, and per-kind counts
Exporting an incident
From AGV Details: click the Export incident button in the page header. A dialog appears with quick presets (Last 5 / 15 / 30 min, Last 1 h) and an adjustable time window.
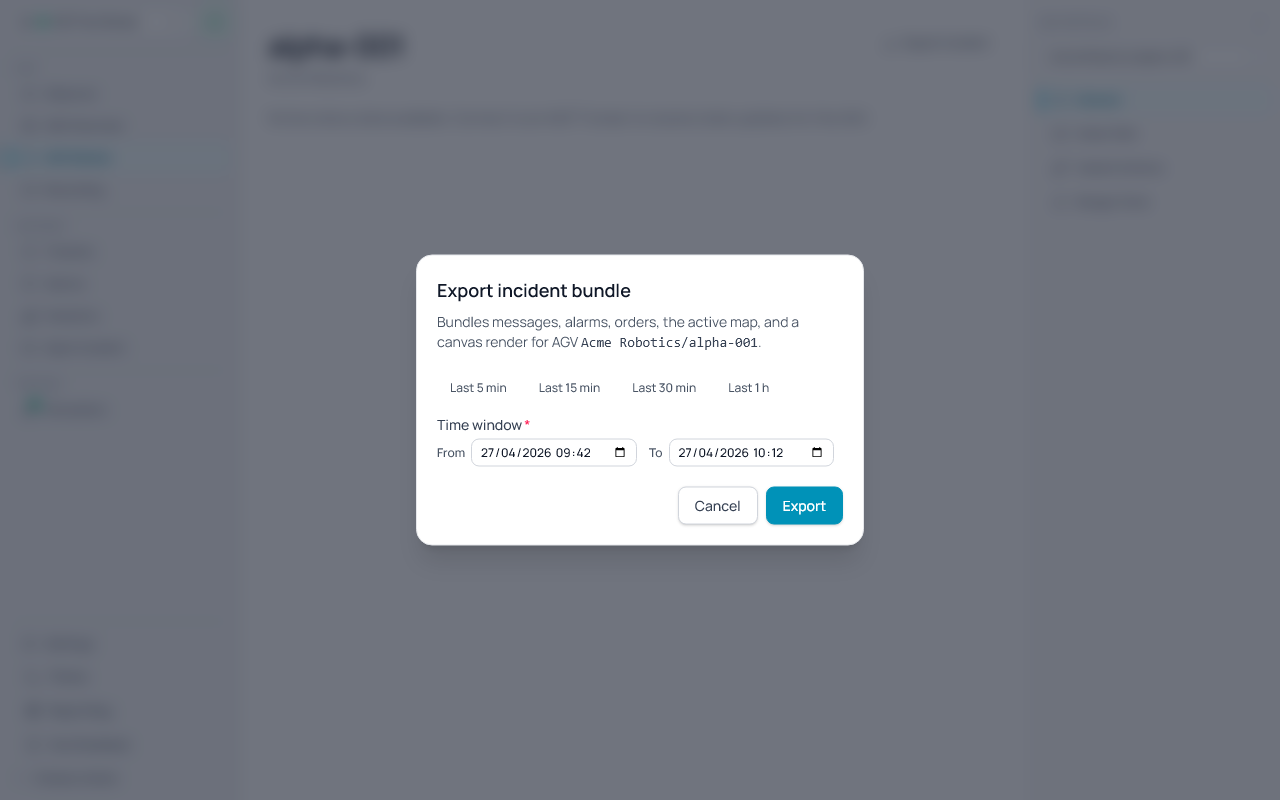
From alarm rows: hover a row on the Alarms page; an export icon appears on the right. Clicking it opens the dialog pre-filled with a ±15 min window around the alarm's start/end times.
After confirming the window, Fletr asks where to save the .fletr.zip, renders the map canvas offscreen, and writes the bundle to disk. A toast reports the bundle's counts when the export completes.
Importing an incident
Click Open Incident… in the Historic section of the left sidebar (alongside Timeline and Alarms). Pick a .fletr.zip and Fletr opens it in a read-only Incident Viewer at /incident/:id.
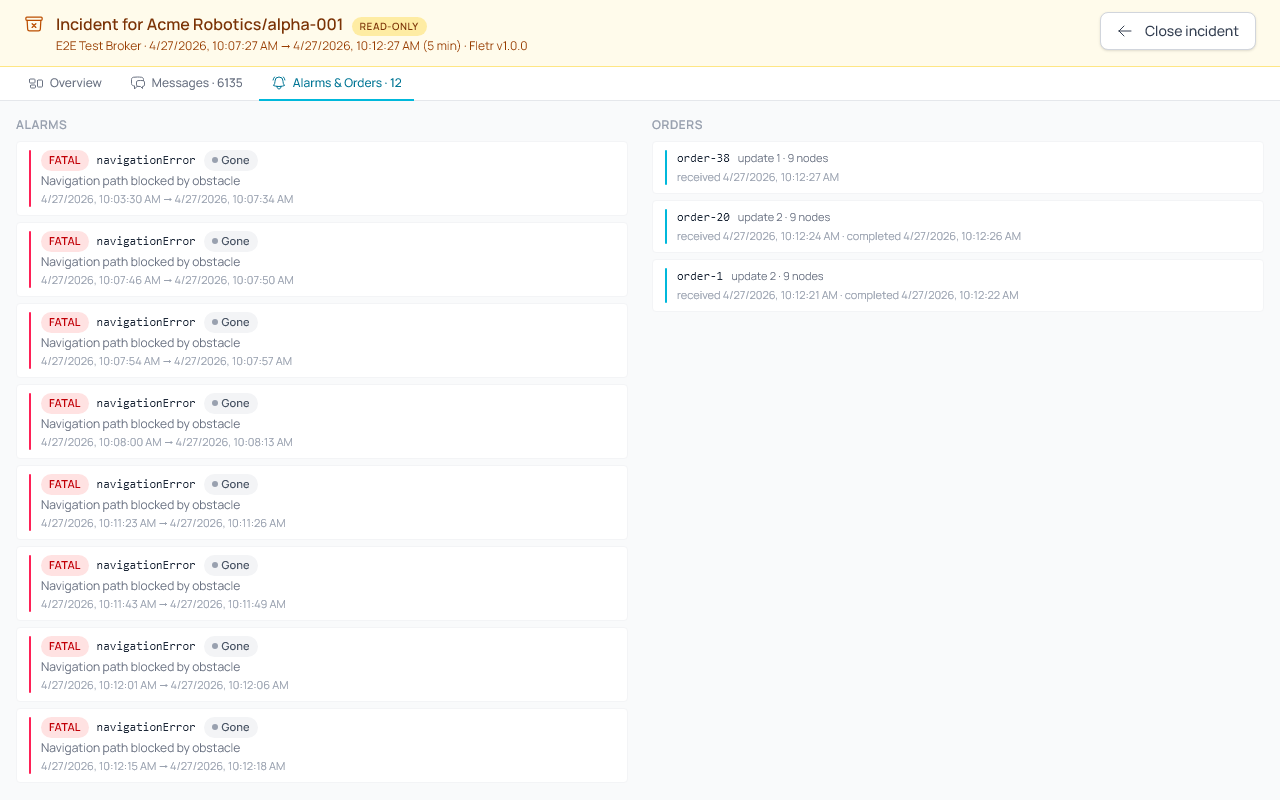
The viewer has three tabs:
- Overview — bundle metadata (server, AGV, window, counts) and the canvas render captured at export.
- Messages — the same message browser you know from Observer: a timeline of reconstructed per-message state, per-topic colored bubbles, click-to-inspect JSON with automatic diff against the previous message on the same topic, Ctrl/Cmd+F search, and a right-hand AGV sidebar with per-AGV and per-topic
Switchtoggles. - Alarms & Orders — the error intervals that overlapped the window and the orders the AGV was running, with their stitched path (node count, order-update boundaries).
A persistent amber banner at the top of the viewer shows Incident for <mfr>/<serial>, the original server, the window, the window duration, and the Fletr version that exported the bundle. It never scrolls off-screen.
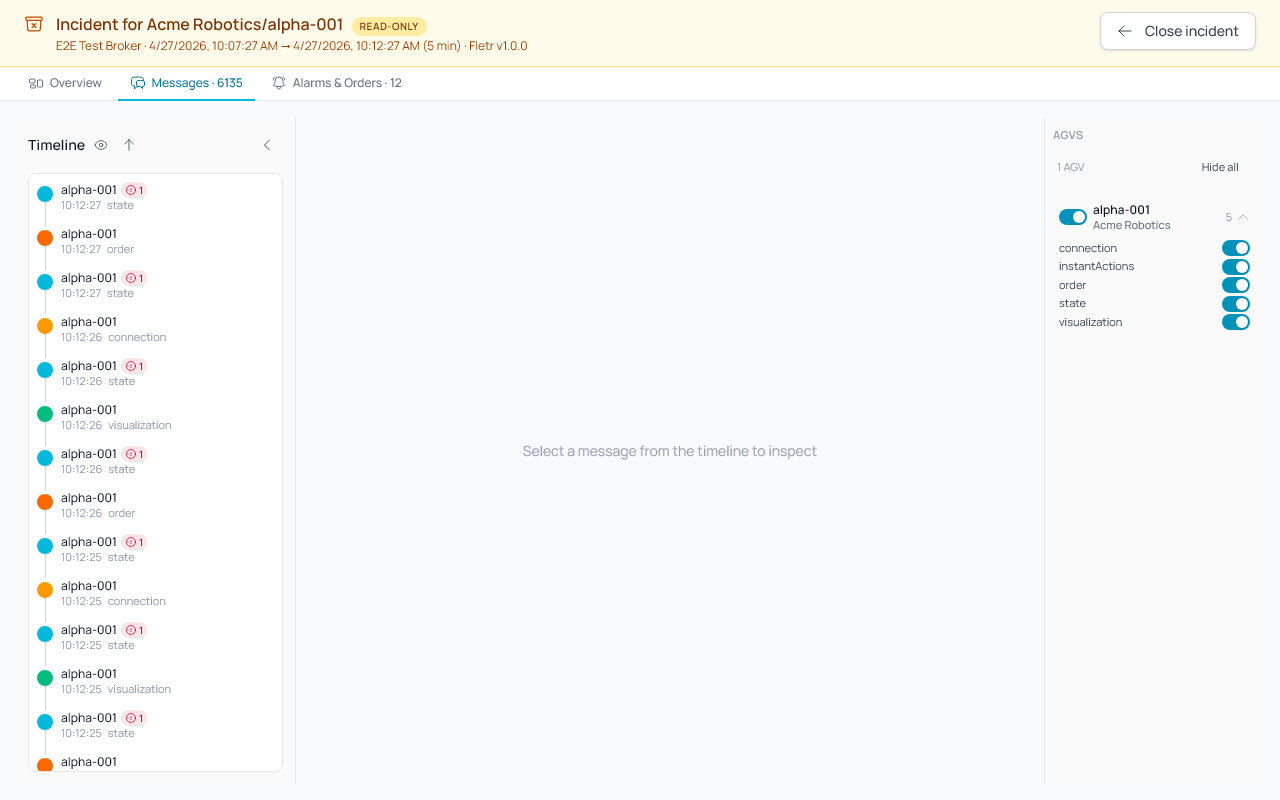
Imported data is held in memory only — it never mixes with your live VDA tables, so importing a bundle for an AGV whose serial matches one of your live AGVs is safe. Close the view (or the app) and the import is discarded.
Bundles from a newer, incompatible schema version are rejected with an error toast.
9. Toast Notifications
The application shows toast notifications to provide real-time feedback for key events:
Success notifications (green)
- Server saved — when a new server is created.
- Server deleted — when a server is removed.
- Connected to broker — when an MQTT connection is established.
- Custom AGV added — when a custom AGV is created.
- Custom AGV deleted — when a custom AGV is removed.
- Simulator started / Simulator stopped — when the simulator is started or stopped.
Error notifications (red)
- Shown when any of the above actions fail (e.g. connection refused, save failed, delete failed).
- Error messages from the backend are included in the notification.
Warning notifications (orange)
- Unexpected broker disconnect — when the connection to the broker is lost without user action (e.g. broker crash, network drop). User-initiated disconnects do not trigger a warning.
- AGV auto-discovery disabled — when the auto-discovery toggle is turned off.
Info notifications (blue)
- New AGV discovered — when a previously unknown AGV is detected for the first time, showing the manufacturer and serial number.
Toasts appear in the bottom-right corner, auto-close after 4 seconds, and respect the current light/dark theme.
Notes
- Supported protocols:
mqtt://andmqtts://. - Server entries, captured messages, and your settings persist across restarts.
- Idle AGVs whose state messages contain no real changes are stored compactly so weeks of background traffic don't bloat the data store.
- If connection fails, check broker URL, credentials, and broker availability.
- All your captured data and configuration live in the Fletr application data folder. Back up that folder to preserve your servers and history:
- Windows:
%APPDATA%\Fletr - macOS:
~/Library/Application Support/Fletr - Linux:
~/.config/Fletr
- Windows: